baby cereal
Launch itA $926K/yr market growing +6.6% this quarter with returns at 0.0% — clears our launch bar.
Returns
Incredible0.0%return rate — above 6% kills the launch gate
Market size
Great$926K$926K/yr · 1.2M searches
Avg price
Great$15.53avg listing price — sweet spot $15–$100
Review moat
Good622.47avg incumbent reviews — the moat a new listing must climb
Price range
Good$3.34–$42.51cheapest to priciest tracked listing — scored on the share inside $15–$100
Competition
Good44%top-5 click share — leaders hold, buyers still browse
Conversion
Good5.0%search→purchase rate — share of searches ending in a sale
Growth
Okay+6.6%90-day search growth — must beat 0% to launch
Quality gap
Bad4.7★avg incumbent rating — lower means beatable quality
Brand share
Bad98%top-5 brand share — brand-locked demand
Competition
The top 5 products take 44% of clicks — established leaders, but buyers still shop beyond them.Brands
7 falling
Sellers
609
Top-5 brand share
98%
Open market
1%
- Gerber59%
- Earth's Best14%
- Amara13%
- Holle9%
- BARI2%
- ELSE NUTRITION1%
- Open — no brand owns it (1 brand, 1%)
Product shelf
Each bubble is one product — market share against review moat; bubble size tracks estimated sales, color grades how beatable the incumbent looks.
All 32 tracked products in this niche — three views at once, no toggling.
Top sellers
by 90-day click share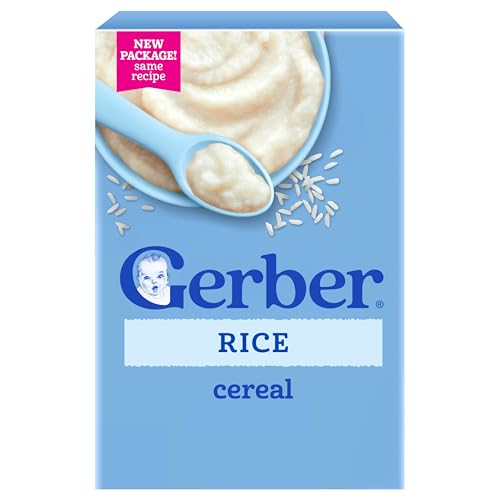
GERBER CEREAL FOR BABY Infant Dry Cereal Rice 1ST FOODS Non GMO Rice 5x8oz
Gerber$17.174.8★68 rev
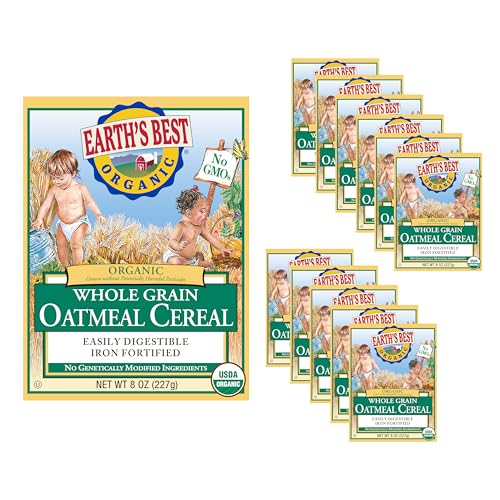
Earths Best Organic Baby Food Organic Whole Grain Oatmeal Baby Cereal Infant Cereal for 4+ Months Clean Label Project Purity Awarded Non-GMO Iron Fortified Easily Digestible 8 oz (Pack of 12)
Earth's Best$42.514.6★1,318 rev

Amara Organic Baby Food - Stage 3 - Ancient Grain - Baby Cereal to Mix With Breastmilk Water or Baby Formula - Shelf Stable Baby Food Made from Organic Fruit & Veggies - 5 Pouches 3.5oz Per Serving
Amara$11.594.1★291 rev
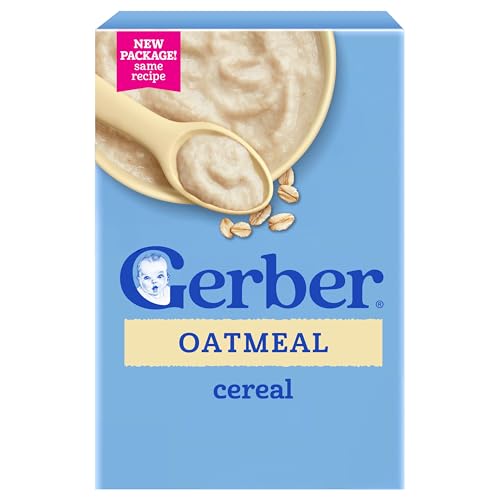
GERBER CEREAL FOR BABY GRAIN AND GROW 1st Foods Non GMO Oatmeal 4x16oz
Gerber$25.395.0★26 rev
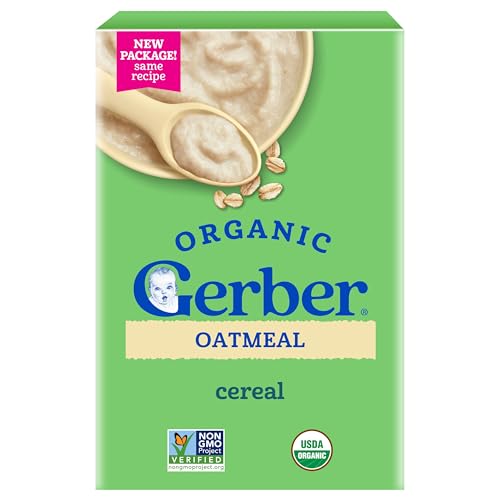
GERBER ORGANIC FOR BABY GRAIN AND GROW 1st Food Oatmeal Cereal 5x8oz
Gerber$20.744.6★28 rev
Newest
by launch dateGERBER CEREAL FOR BABY Infant Dry Cereal Rice 1ST FOODS Non GMO Rice 5x8oz
Gerber$17.1768 rev
GERBER CEREAL FOR BABY GRAIN AND GROW 1st Foods Non GMO Oatmeal 4x16oz
Gerber$25.3926 rev
GERBER ORGANIC FOR BABY GRAIN AND GROW 1st Food Oatmeal Cereal 5x8oz
Gerber$20.7428 rev
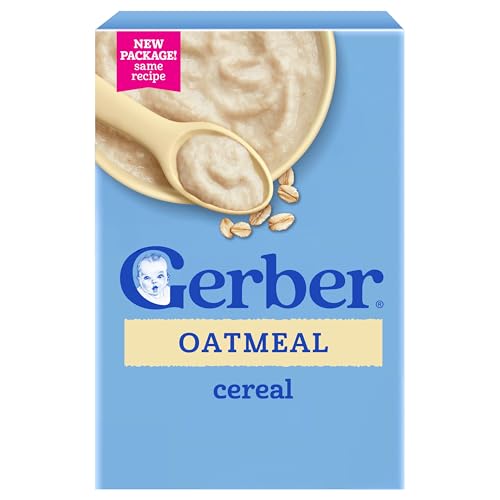
GERBER CEREAL FOR BABY GRAIN AND GROW 1st Foods Non GMO Oatmeal 5x8oz
Gerber$16.8340 rev
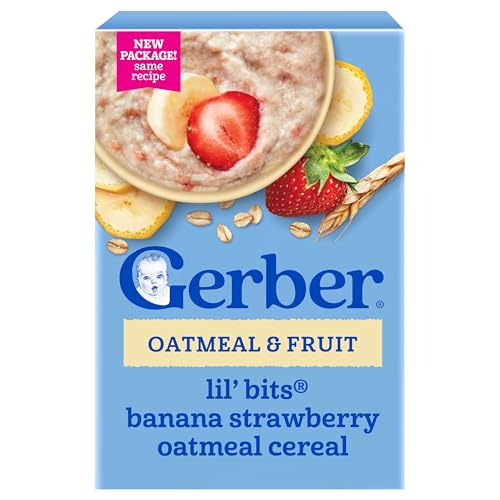
GERBER CEREAL FOR BABY GRAIN AND GROW Toddler Oatmeal Banana Strawberry 5x8oz
Gerber$16.911,411 rev
Trending
90-day click momentum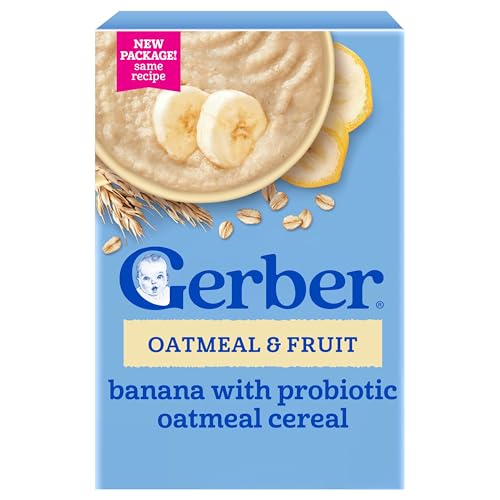
GERBER CEREAL FOR BABY GRAIN AND GROW Toddler Oatmeal Banana Probiotic BL 5x8oz
Gerber$16.904.7★
GERBER CEREAL FOR BABY GRAIN AND GROW 1st Foods Non GMO Oatmeal 4x16oz
Gerber$25.395.0★
GERBER CEREAL FOR BABY GRAIN AND GROW 1st Foods Non GMO Oatmeal 5x8oz
Gerber$16.834.6★
GERBER CEREAL FOR BABY GRAIN AND GROW Toddler Oatmeal Banana Strawberry 5x8oz
Gerber$16.914.8★
GERBER ORGANIC FOR BABY GRAIN AND GROW 1st Food Oatmeal Cereal 5x8oz
Gerber$20.744.6★
Demand & seasonality
Weekly Amazon search volume, last 104 weeks — +6.6% search growth over the last 90 days.No pronounced peak months · busiest ÷ quietest = 1.4×
Reviews
What buyers praise and complain about, mined from review topics.What buyers love
“Great Taste”
“Great quality, clean ingredients, and the taste seems much better compared to other brands”
“so its a good solid option if youre wanting to be health conscious”
“Excellent value”
“Easy to use”
“Good consistency”
“did like the organic ingredients”
“The flavors are great”
“High quality ingredients”
“It mixes smoothly”
What buyers complain about
“The taste is very bland as it should be”
“Price point could be better”
“The cereal now have a stale smell”
“I made it thicker here than usual”
“Its hard to see anything have such basic ingredients nowadays that you can actually pronounce”
“it made him constipated”
“The advertised picturesdoes not match the true size of this box”
“Texture based on liquid amount”
“The quality is worsen”
“There was busted food in the box”