upper control arm bushing
Worth a lookShows a thin review moat (97 avg reviews), but weak search conversion (1.5%) keeps it on the watch list.
Review moat
Incredible97.19avg incumbent reviews — the moat a new listing must climb
Avg price
Incredible$33.85avg listing price — sweet spot $15–$100
Price range
Great$9.74–$101.48cheapest to priciest tracked listing — scored on the share inside $15–$100
Competition
Great32%top-5 click share — an open shelf
Quality gap
Great4.3★avg incumbent rating — lower means beatable quality
Brand share
Good73%top-5 brand share — brands hold most of the demand
Returns
Okay4.7%return rate — above 6% kills the launch gate
Market size
Okay$113K$113K/yr · 225K searches
Growth
Bad-5.7%90-day search growth — must beat 0% to launch
Conversion
Bad1.5%search→purchase rate — share of searches ending in a sale
Competition
Clicks spread well past the top 5 (32% combined) — an open shelf where new products get seen.Brands
23 falling
Sellers
113
Top-5 brand share
73%
Open market
22%
- MOOG40%
- A-Premium16%
- NewYall6%
- ACDelco6%
- MOTOKU5%
- APDTY4%
Product shelf
Each bubble is one product — market share against review moat; bubble size tracks estimated sales, color grades how beatable the incumbent looks.
All 63 tracked products in this niche — three views at once, no toggling.
Top sellers
by 90-day click share
DRiV MOOG Suspension Control Arm Bushing Kit - K6658 - High-Quality Elastomer Suspension - Hassle-Free Installation - Long-Lasting Quiet Operation for Auto Repair Replacement
MOOG$20.794.5★455 rev

MOOG K6688 Suspension Control Arm Bushing Kit for Chevrolet Silverado 1500
MOOG$18.264.4★180 rev

MOOG K3128 Suspension Control Arm Bushing Kit for Jeep Wrangler
MOOG$10.824.6★1,138 rev
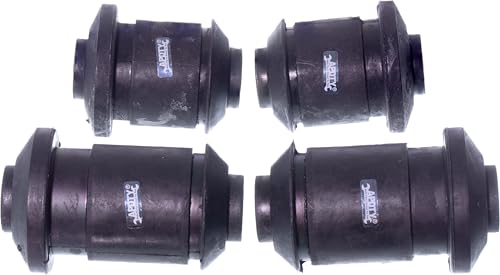
APDTY 146263x2 Front Lower Control Arm Replacement Bushing Set (Left & Right)
APDTY$49.133.9★3 rev
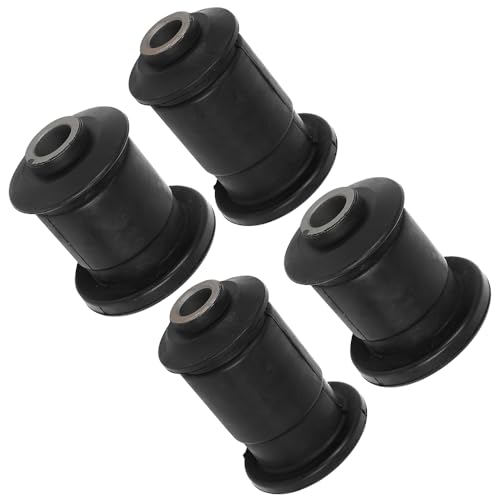
SCITOO Front Suspension Part K6658 Lower Control Arm Bushing fit for Cadillac Escalade 2002-2004 2006 for Cadillac Escalade EXT 2002-2005
SCITOO$28.173.9★14 rev
Newest
by launch date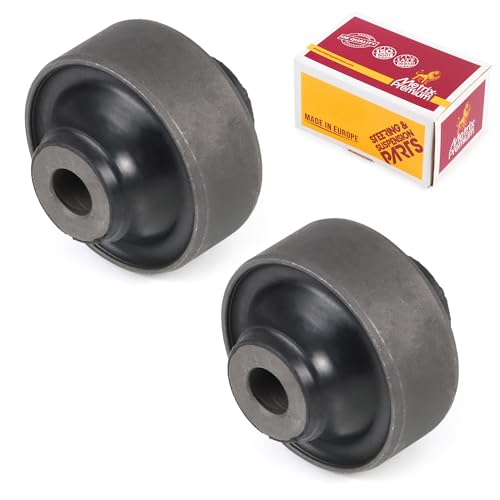
Metrix Premium Chassis Parts - 2 PC Front Lower Rearward Control Arm Bushing Kit Fits 2001-2006 Acura MDX 1999-2004 Honda Odyssey 2003-2008 Pilot 06-14 Ridgeline Replacement BC59280 Made in Europe
METRIX PREMIUM CHASSIS PARTS$36.10337 rev
APDTY 146263x2 Front Lower Control Arm Replacement Bushing Set (Left & Right)
APDTY$49.133 rev
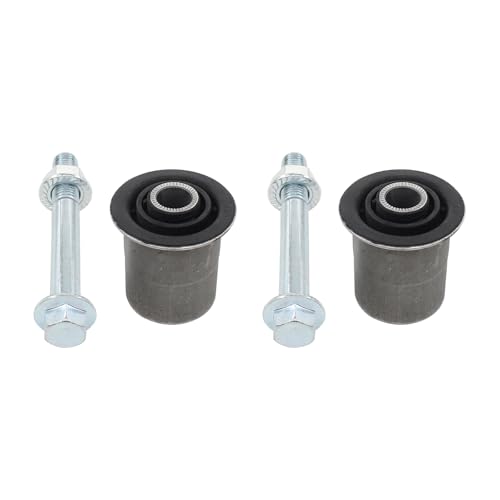
Roneeson Front Lower Control Arm Strut Shock Bushing Kit for Ram 1500 2011-2018 1500 Classic 2019-2024 Dakota 2011 Dodge Ram 1500 2006-2010 Dakota 2009-2012
Roneeson$30.011 rev
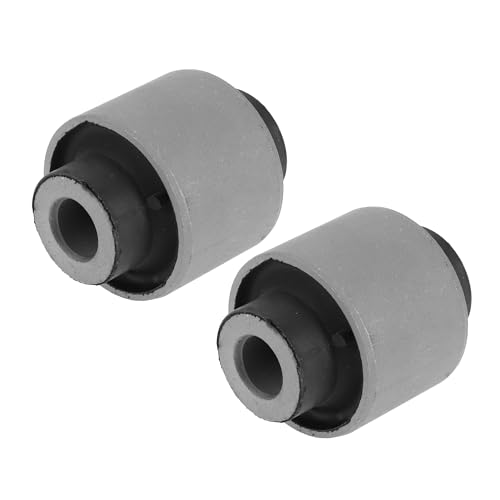
HEROFFIX 2 Pcs Control Arm Bushing for Honda Element CR-V Civic Odyssey for Acura RSX Integra Rear Lower No.52364S5A004 Replace Parts
HEROFFIX$18.275 rev
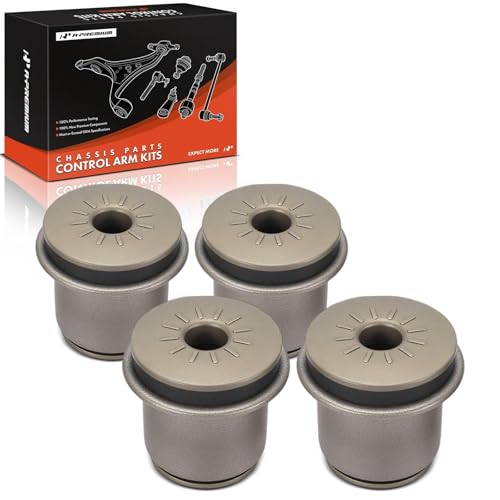
A-Premium 4 x Front Upper Control Arm Bushing Kit Compatible with Chevrolet Silverado 1500 Tahoe Suburban Express 2500 Avalanche & GMC Sierra 1500 Yukon Savana 3500 & Cadillac Escalade
A-Premium$47.797 rev
Trending
90-day click momentumRoneeson Front Lower Control Arm Strut Shock Bushing Kit for Ram 1500 2011-2018 1500 Classic 2019-2024 Dakota 2011 Dodge Ram 1500 2006-2010 Dakota 2009-2012
Roneeson$30.011.0★
Metrix Premium Chassis Parts - 2 PC Front Lower Rearward Control Arm Bushing Kit Fits 2001-2006 Acura MDX 1999-2004 Honda Odyssey 2003-2008 Pilot 06-14 Ridgeline Replacement BC59280 Made in Europe
METRIX PREMIUM CHASSIS PARTS$36.104.6★
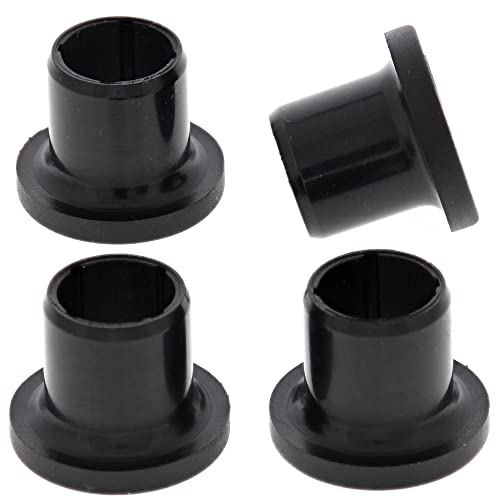
All Balls Racing 50-1051 A-Arm Bushing Kit Compatible with/Replacement for Polaris Sportsman 500 Outlaw Others
All Balls$19.134.4★
APDTY 146263x2 Front Lower Control Arm Replacement Bushing Set (Left & Right)
APDTY$49.133.9★
HEROFFIX 2 Pcs Control Arm Bushing for Honda Element CR-V Civic Odyssey for Acura RSX Integra Rear Lower No.52364S5A004 Replace Parts
HEROFFIX$18.273.9★
Demand & seasonality
Weekly Amazon search volume, last 91 weeks — -5.7% search growth over the last 90 days.No pronounced peak months · busiest ÷ quietest = 1.7×
Reviews
What buyers praise and complain about, mined from review topics.What buyers love
“Fit good”
“Good parts”
“great price”
“are very durable”
“Easy enough to install”
“product is what we expected”
“Worked as aspected”
“Sturdy”
“This fixed all my problems works good with my 09 polaris ranger 700xp good replacement parts”
“the part is still very new”
What buyers complain about
“They look smaller”
“Junk”
“The bushings don't even look like the picture”
“Getting the control arms off, pressing out the old bushings, and installing the new ones takes proper tools and time, especially if the original bushings are seized or dry-rotted”
“Cheap plastic”
“The tolerances on these bushings are not correct”
“Stiffened up the ole ride right up”
“They are to thick”
“This is not a quick job”
“so I don't expect these to last very long at all”