trailer jack foot
Worth a lookShows searches that convert (9.1% search→purchase), but strong incumbent ratings (4.6★) keeps it on the watch list.
Conversion
Great9.1%search→purchase rate — share of searches ending in a sale
Avg price
Great$16.43avg listing price — sweet spot $15–$100
Review moat
Great456.65avg incumbent reviews — the moat a new listing must climb
Growth
Good+47.1%90-day search growth — must beat 0% to launch
Price range
Good$4.31–$33.77cheapest to priciest tracked listing — scored on the share inside $15–$100
Returns
Good2.9%return rate — above 6% kills the launch gate
Brand share
Okay76%top-5 brand share — brands hold most of the demand
Competition
Okay59%top-5 click share — leaders hold, buyers still browse
Market size
Okay$127K$127K/yr · 85K searches
Quality gap
Bad4.6★avg incumbent rating — lower means beatable quality
Competition
The top 5 products take 59% of clicks — established leaders, but buyers still shop beyond them.Brands
15 flat
Sellers
26
Top-5 brand share
76%
Open market
21%
- CURT27%
- TOWKING27%
- BEBLEPANY8%
- rockane7%
- Aupar7%
- HNeekyr4%
Product shelf
Each bubble is one product — market share against review moat; bubble size tracks estimated sales, color grades how beatable the incumbent looks.
All 23 tracked products in this niche — three views at once, no toggling.
Top sellers
by 90-day click share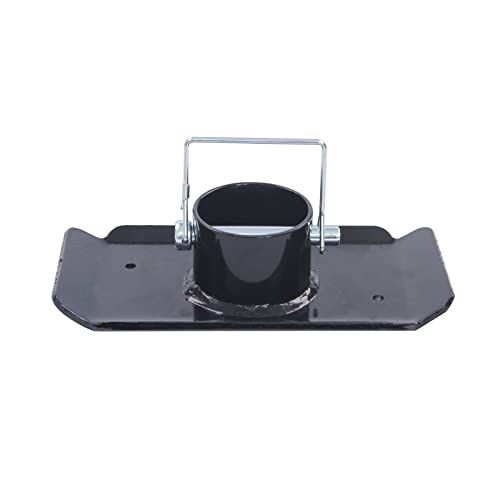
TOWKING 5000lbs Trailer Jack Foot Plate with Pin Base Black
TOWKING$14.214.8★280 rev
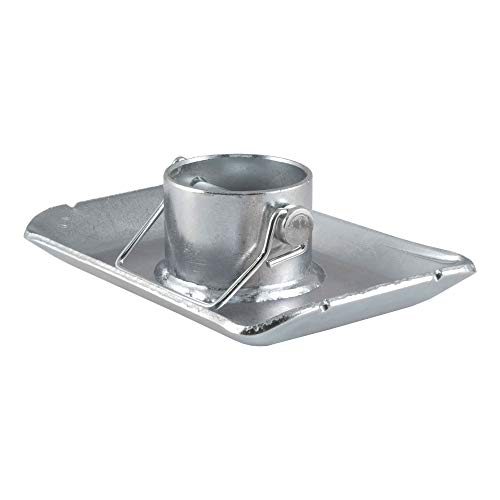
CURT 28272 Trailer Jack Foot Fits 2-Inch Diameter Tube Supports 2 000 lbs
CURT$9.894.8★6,000 rev

CURT 28270 Trailer Jack Foot Fits 2-Inch Diameter Tube Supports 2 000 lbs
CURT$4.314.6★904 rev
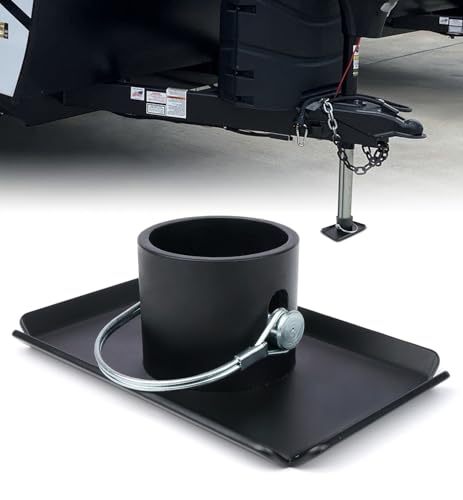
Aupar Trailer Jack Foot Plate with Pin Base 5000lbs Capacity Foot Pad Compatible with Boat Trailer Jack Tongue Parts Boat Hitch Camper RV A-Frame Boat - Black
Aupar$14.084.5★276 rev
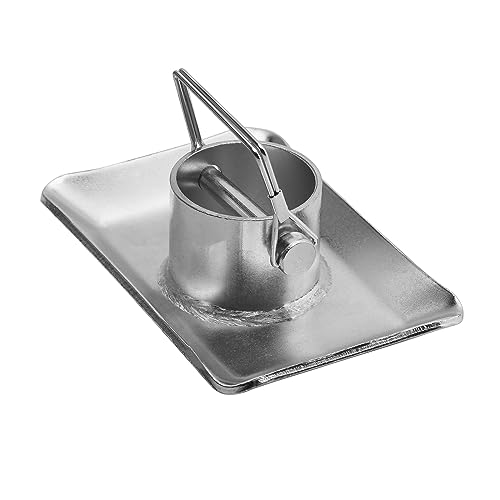
Rockane Trailer Jack Foot Plate 5000lbs Capacity with Pin Base for Boat Hitch Camper A-Frame Boat RV - Removable Trailer Foot Plate
rockane$13.564.7★279 rev
Newest
by launch date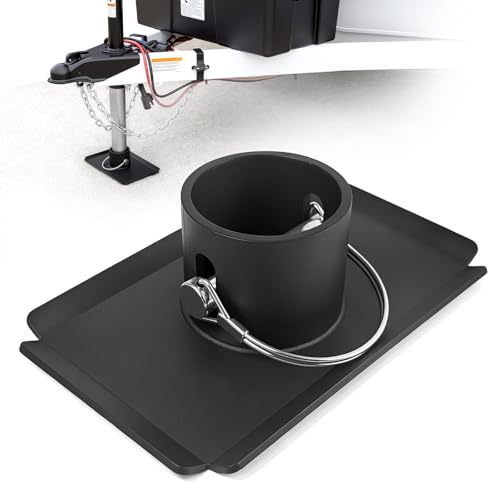
Removable Trailer Jack Foot Plate 5000lbs Capacity with Pin Base for A-Frame Trailer Jack Trailer Jack Block Trailer Jack Stand Trailer Tongue Jack Wheel Boat Trailer Parts for RV Camper Trailers
HAPANGODIR$11.8836 rev
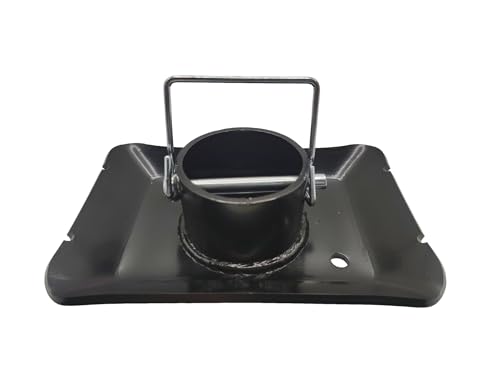
Trailer Jack Foot Plate 5000lbs Capacity with Pin Base for Boat Hitch Camper A-Frame Boat RV - Removable Trailer Foot Plate (Black)
FLEXKEA$13.0817 rev
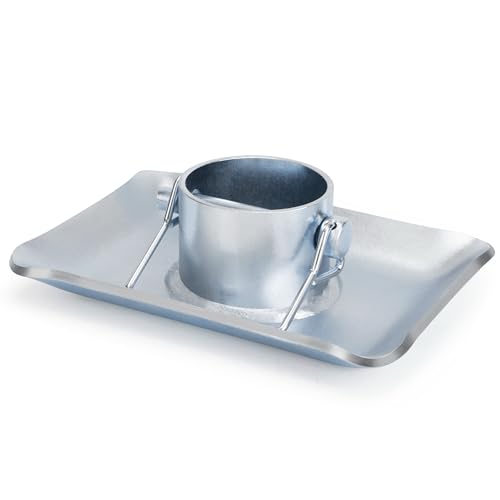
Lonffery Trailer Jack Foot Plate with Pin Base Fits Standard 2 Inch Trailer Jack 5000 lb Capacity Heavy Duty Galvanized Steel for RV Utility Trailers and Cargo Trailers
Lonffery$10.4612 rev
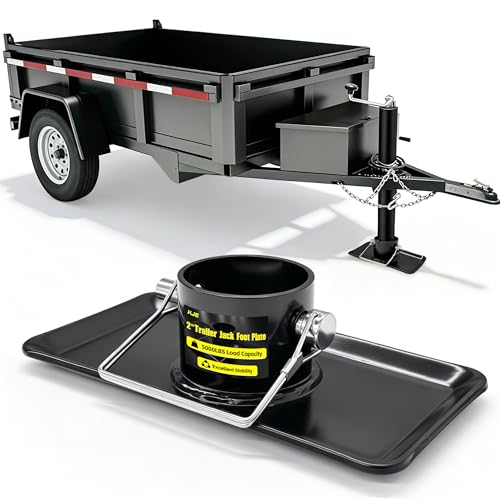
KJE 2 Trailer Jack Foot Plate with Pin Base 5000lbs Load Capacity Compatible for Boat Hitch Camper A-Frame Boat RV - Removable Trailer Jack Pad Black
KJE$13.680 rev
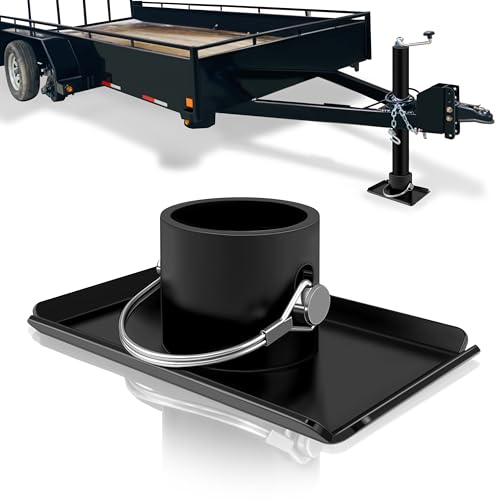
VONLX Removable Trailer Jack Base Plate (with Pin Base) 5000lbs Capacity Black Foot Pad Compatible with A-Frame Boat Boat Hitch Camper Boat Trailer Jack Tongue Parts RV
VONLX$11.8720 rev
Trending
90-day click momentumRemovable Trailer Jack Foot Plate 5000lbs Capacity with Pin Base for A-Frame Trailer Jack Trailer Jack Block Trailer Jack Stand Trailer Tongue Jack Wheel Boat Trailer Parts for RV Camper Trailers
HAPANGODIR$11.884.8★
KJE 2 Trailer Jack Foot Plate with Pin Base 5000lbs Load Capacity Compatible for Boat Hitch Camper A-Frame Boat RV - Removable Trailer Jack Pad Black
KJE$13.680.0★
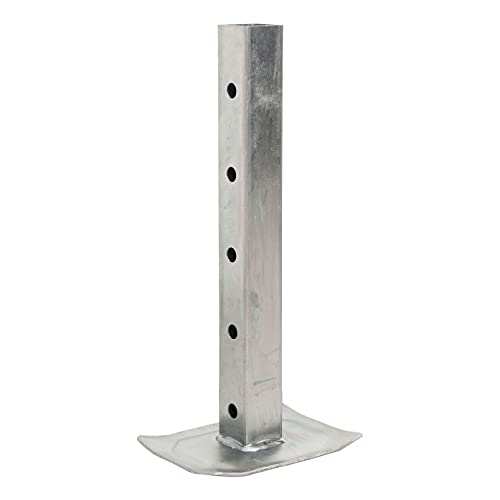
Curt 28962 Replacement Jack Leg and Foot
CURT$31.324.4★
Lonffery Trailer Jack Foot Plate with Pin Base Fits Standard 2 Inch Trailer Jack 5000 lb Capacity Heavy Duty Galvanized Steel for RV Utility Trailers and Cargo Trailers
Lonffery$10.464.8★

Curt 28274 Jack Foot
CURT$16.054.6★
Demand & seasonality
Weekly Amazon search volume, last 104 weeks — +47.1% search growth over the last 90 days.Peak months: Apr, May · busiest ÷ quietest = 2.4×
Reviews
What buyers praise and complain about, mined from review topics.What buyers love
“Fit is good”
“Build quality is strong”
“Well built”
“Good value”
“Easy installation”
“WORKED AS IT SHOULD”
“Heavy duty”
“Very convenient”
“Quality material and holds up well”
“which I feel is less likely to rust”
What buyers complain about
“To short”
“Well, I looked at it and it's pretty rusty”
“No safety pin”
“Very sharp jagged edges”
“The thickness of the material used to make this is noticeably thicker than the factory foot that came on my utility trailer”
“It is hard to say if this is a great deal”
“it actually affects the rain runoff on my cover”
“it actually affects the rain runoff on my cover”
“Not as pictured”
“it did not fit a standard trailer jack column”