teslatap
Skip itBrand-locked demand (top 5 brands take 100% of clicks) — this niche doesn't clear our bar today.
Conversion
Great9.7%search→purchase rate — share of searches ending in a sale
Review moat
Great311avg incumbent reviews — the moat a new listing must climb
Quality gap
Good4.4★avg incumbent rating — lower means beatable quality
Growth
Good+25.0%90-day search growth — must beat 0% to launch
Avg price
Good$165.13avg listing price — sweet spot $15–$100
Market size
Okay$153K$153K/yr · 10K searches
Price range
Bad$51.89–$295.39cheapest to priciest tracked listing — scored on the share inside $15–$100
Competition
Bad89%top-5 click share — a locked-up shelf
Returns
Bad10.5%return rate — above 6% kills the launch gate
Brand share
Bad100%top-5 brand share — brand-locked demand
Competition
The top 5 products capture 89% of clicks — a locked-up shelf that new listings rarely crack.Brands
4 falling
Sellers
9
Top-5 brand share
100%
Open market
0%
- TeslaTap76%
- Lectron14%
- FOCSPROD7%
- VIPTOO3%
Product shelf
Each bubble is one product — market share against review moat; bubble size tracks estimated sales, color grades how beatable the incumbent looks.
All 8 tracked products in this niche — three views at once, no toggling.
Top sellers
by 90-day click share
TeslaTap Mini - Tesla to J-1772 Adapter - 60 AMP - Made in USA
TeslaTap$261.544.5★115 rev
TeslaTap Mini - Tesla to J-1772 Adapter - 80 AMP - Made in USA (TTMINI80)
TeslaTap$295.394.4★62 rev

Lectron Tesla to J1772 EV Charging Adapter NACS Converter 48 Amp & 240V Compatible with Tesla High Powered Connectors Destination Chargers & Mobile Connectors for J1772 Electric Vehicles (Black)
Lectron$110.254.0★1,912 rev
TeslaTap Mini - Tesla to J-1772 Adapter - 40 AMP - Made in USA
TeslaTap$201.824.3★31 rev
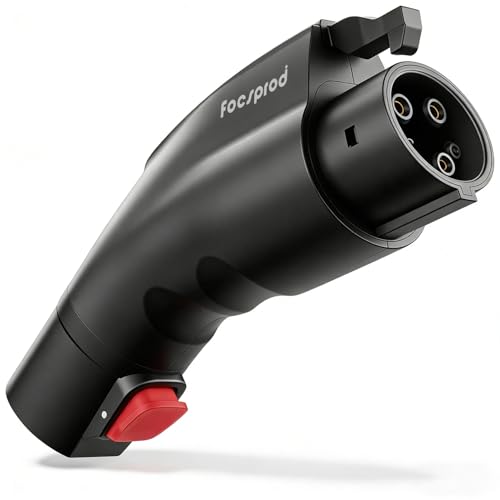
FOCSPROD for Tesla to J1772 Charger Adapter Max 60A 250V for NACS to J1772 Electric Vehicles Charging Adapter Compatible with Tesla Mobile/Wall Connectors Destination Chargers -UL 2252
FOCSPROD$57.364.2★121 rev
Newest
by launch date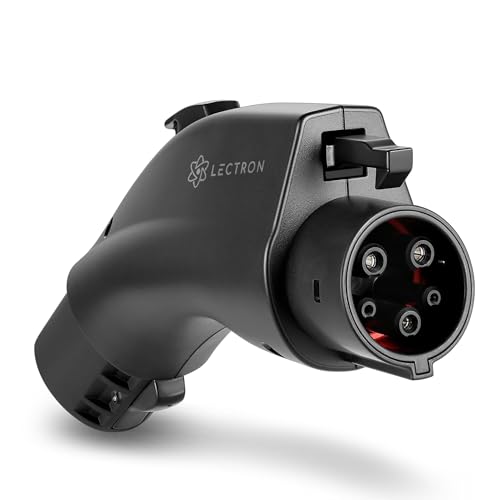
Lectron NACS to J1772 EV Charging Adapter - Compatible with Tesla Wall Connectors Destination Chargers & Mobile Connectors (80A 240V) - for J1772 Electric Vehicles - UL 2252 Certified (Black)
Lectron$163.54104 rev
FOCSPROD for Tesla to J1772 Charger Adapter Max 60A 250V for NACS to J1772 Electric Vehicles Charging Adapter Compatible with Tesla Mobile/Wall Connectors Destination Chargers -UL 2252
FOCSPROD$57.36121 rev
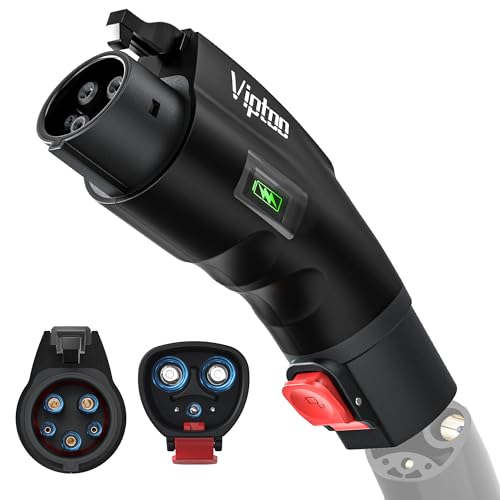
VIPTOO Tesla to J1772 Adapter 60A 250V AC NACS EV Charging Connector with Charging Status Display for Tesla Wall/Destination/Mobile Charger Fast & Safe Charging (Black)
VIPTOO$51.8963 rev
Lectron Tesla to J1772 EV Charging Adapter NACS Converter 48 Amp & 240V Compatible with Tesla High Powered Connectors Destination Chargers & Mobile Connectors for J1772 Electric Vehicles (Black)
Lectron$110.251,912 rev
TeslaTap Mini - Tesla to J-1772 Adapter - 60 AMP - Made in USA
TeslaTap$261.54115 rev
Trending
90-day click momentumVIPTOO Tesla to J1772 Adapter 60A 250V AC NACS EV Charging Connector with Charging Status Display for Tesla Wall/Destination/Mobile Charger Fast & Safe Charging (Black)
VIPTOO$51.894.4★
TeslaTap Mini - Tesla to J-1772 Adapter - 40 AMP - Made in USA
TeslaTap$201.824.3★
Lectron NACS to J1772 EV Charging Adapter - Compatible with Tesla Wall Connectors Destination Chargers & Mobile Connectors (80A 240V) - for J1772 Electric Vehicles - UL 2252 Certified (Black)
Lectron$163.544.6★
FOCSPROD for Tesla to J1772 Charger Adapter Max 60A 250V for NACS to J1772 Electric Vehicles Charging Adapter Compatible with Tesla Mobile/Wall Connectors Destination Chargers -UL 2252
FOCSPROD$57.364.2★
TeslaTap Mini - Tesla to J-1772 Adapter - 60 AMP - Made in USA
TeslaTap$261.544.5★
Demand & seasonality
Weekly Amazon search volume, last 84 weeks — +25.0% search growth over the last 90 days.Peak months: Sep, Oct, Nov, Dec · busiest ÷ quietest = 9.5×
Reviews
What buyers praise and complain about, mined from review topics.What buyers love
“It allows me to charge my battery up quickly”
“Is as advertised”
“Good quality”
“Does the job perfectly”
“Great value”
“it comes in handy”
“Fit is perfect”
“The connection is solid”
“durability is excellent”
“beefy build”
What buyers complain about
“Rendering it unable to charge”
“Does not last”
“Charger overheats”
“Didn't work”
“Didn't fit my EV”
“The others would not connect. handshake”
“It isnt inexpensive”
“caused catastrophic corrosion to the pin”
“Doesn't suit the purpose that it was described as doing”
“The 48 amp version of the product didn't work with my Audi Q6”