ram rear bumper
Worth a lookShows a thin review moat (19 avg reviews), but a failed launch gate (market size, growth, or returns) keeps it on the watch list.
Review moat
Incredible18.68avg incumbent reviews — the moat a new listing must climb
Returns
Incredible0.5%return rate — above 6% kills the launch gate
Quality gap
Incredible3.9★avg incumbent rating — lower means beatable quality
Competition
Great27%top-5 click share — an open shelf
Brand share
Great52%top-5 brand share — no brand owns this niche
Market size
Okay$227K$227K/yr · 82K searches
Avg price
Okay$270.69avg listing price — sweet spot $15–$100
Growth
Bad-8.2%90-day search growth — must beat 0% to launch
Conversion
Bad1.0%search→purchase rate — share of searches ending in a sale
Price range
Bad$92.49–$682.75cheapest to priciest tracked listing — scored on the share inside $15–$100
Competition
Clicks spread well past the top 5 (27% combined) — an open shelf where new products get seen.Brands
28 falling
Sellers
33
Top-5 brand share
52%
Open market
42%
- VRC18%
- Auto Dynasty12%
- YZONA10%
- Generic7%
- ALMULOO5%
- PM PERFORMOTOR5%
Product shelf
Each bubble is one product — market share against review moat; bubble size tracks estimated sales, color grades how beatable the incumbent looks.
All 66 tracked products in this niche — three views at once, no toggling.
Top sellers
by 90-day click share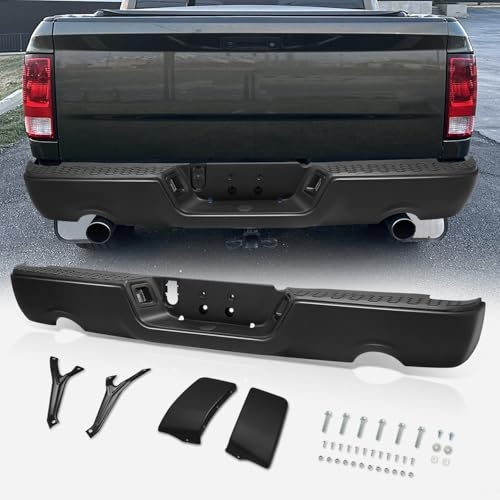
Auto Dynasty Rear Bumper Step Pad Compatible with 2009-2018 Dodge Ram 1500/2019-2024 Ram 1500 Classic Protector Cover w/License Plate Lights Dual Exhaust Cutouts CH1103123 Painted Black
Auto Dynasty$186.154.2★47 rev
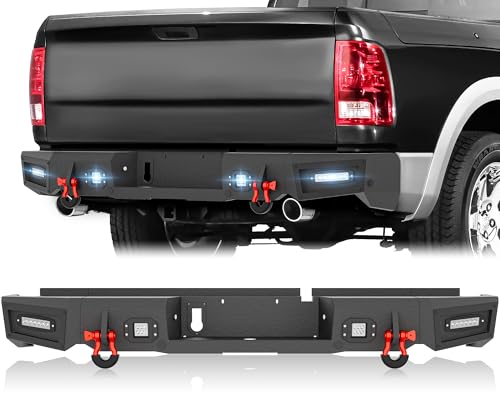
YZONA for Ram 1500 Rear Step Bumper Compatible with 2009-2018 Dodge Ram 1500 & 2019-2024 Ram 1500 Classic Bumper with 4 x 18W LED Lights License Plate Lights Paintable Armor & D-rings Sensor Holes
YZONA$386.034.3★90 rev
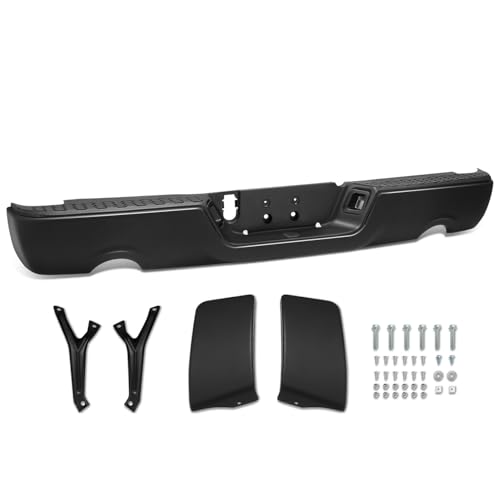
Rear Step Bumper Compatible with 2009-2018 Dodge Ram 1500 & 2019 Ram 1500 Classic with Dual Exhaust Holes fits models w/o Backup Sensors Black Steel
PM PERFORMOTOR$176.303.3★3 rev
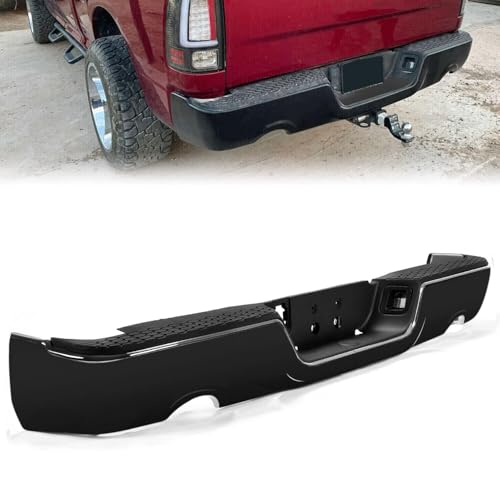
KUAFU Rear Step Bumper Assembly Compatible with 2009-2022 Dodge RAM 1500 W/Dual & license lamp W/O Sensor Holes Replacement For CH1103123 Two Packages
KUAFU$182.803.5★52 rev
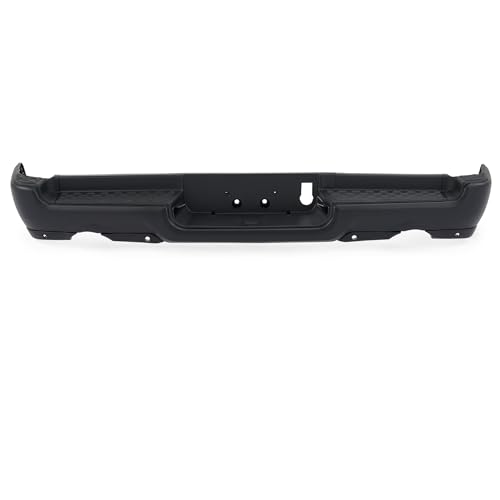
VRC Rear Bumper Assembly Compatible with 2019 2020 2021 2022 2023 2024 Dodge Ram 1500 Heavy-Duty Steel Black Rear Bumper CH1103140 With Dual&Sensor(Black Dual Exhaust & W/Sensor Holes)
VRC$295.553.5★7 rev
Newest
by launch date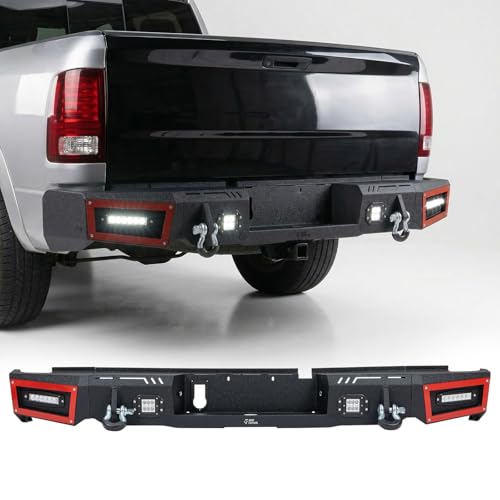
JOYTUTUS Rear Bumper Compatible with Ram 1500 2009-2018 & Classic 2019-2024 Truck Back Bumper w/LED Lights 3/4 D-Rings Tow Hitch Heavy Duty Steel
JOYTUTUS$370.152 rev
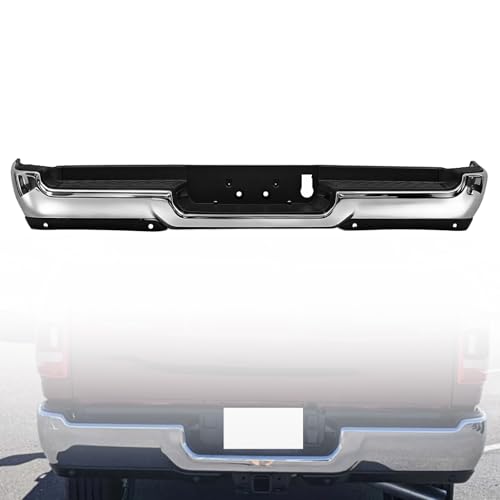
Chrome Rear Step Bumper Assembly for 2019-2024 Ram 1500 | with Sensor Holes Single Exhaust Only | NOT for Rebel TRX 5.7L | Direct Fit
LAFORMO$285.401 rev
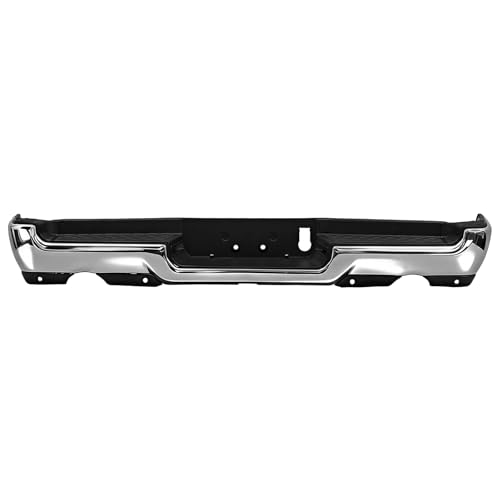
Chrome Rear Step Bumper Assembly for 2019-2024 Ram 1500 | with Sensor Holes & Dual Exhaust | Direct Fit
LAFORMO$283.950 rev
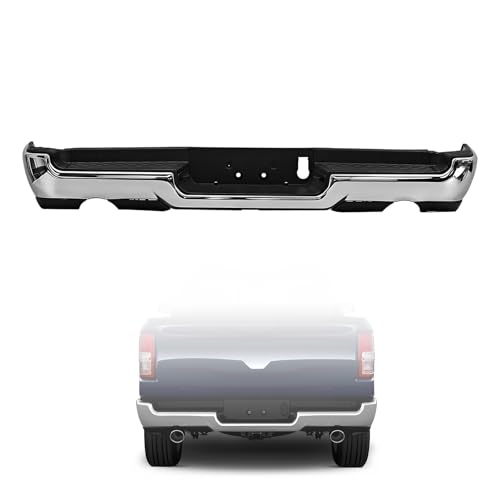
Chrome Rear Step Bumper Assembly for 2019-2024 Ram 1500 | with Dual Exhaust NO Sensor Holes | NOT for Rebel TRX 3.6L | Direct Fit
LAFORMO$283.941 rev
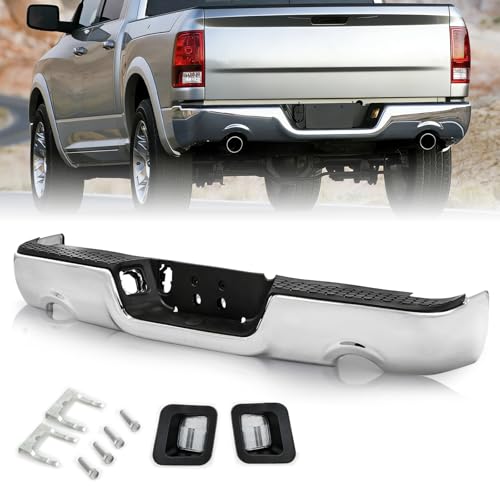
TUSDAR Chrome Rear Bumper Assembly Fits for 2009-2018 Dodge Ram 1500 2500 3500 2019-2023 1500 Ram Classic One-piece Design w/o Parking Assist Sensor w/Dual Exhaust
TUSDAR$207.461 rev
Trending
90-day click momentumChrome Rear Step Bumper Assembly for 2019-2024 Ram 1500 | with Sensor Holes & Dual Exhaust | Direct Fit
LAFORMO$283.950.0★
TUSDAR Chrome Rear Bumper Assembly Fits for 2009-2018 Dodge Ram 1500 2500 3500 2019-2023 1500 Ram Classic One-piece Design w/o Parking Assist Sensor w/Dual Exhaust
TUSDAR$207.463.0★
JOYTUTUS Rear Bumper Compatible with Ram 1500 2009-2018 & Classic 2019-2024 Truck Back Bumper w/LED Lights 3/4 D-Rings Tow Hitch Heavy Duty Steel
JOYTUTUS$370.155.0★
Chrome Rear Step Bumper Assembly for 2019-2024 Ram 1500 | with Sensor Holes Single Exhaust Only | NOT for Rebel TRX 5.7L | Direct Fit
LAFORMO$285.405.0★
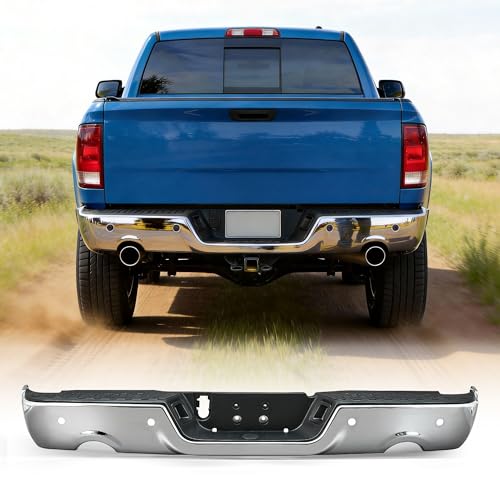
VRC Rear Bumper Assembly Compatible with 2009-2018 Dodge Ram 1500/10-18 Ram 2500 3500 Chrome Steel Bumper With License Plate Lights (Chrome W/Dual Exhaust & W/Sensor Holes)
VRC$175.500.0★
Demand & seasonality
Weekly Amazon search volume, last 104 weeks — -8.2% search growth over the last 90 days.Peak months: Mar · busiest ÷ quietest = 1.6×
Reviews
What buyers praise and complain about, mined from review topics.What buyers love
“Fit is good”
“he told us our installation was perfect”
“Great deal”
“Solid build, easy install, and consistent quality”
“Construction awesome”
“its sturdy”
“Very heavy duty”
“Very light and cheesy nade”
“The steel construction feels heavy-duty”
“I already have one of their products on my Jeep, and its been holding up really well—built correctly, really strong, and easier to install than I expected”
What buyers complain about
“it didnt really fit”
“Very low quality”
“bad chrome, bad bends, plastic not fit well”
“No INSTRUCTIONS”
“Paid $80 for Shipping”
“crazy it didn't match”
“junk- started rusting within 60 days of install”
“a few areas was not aligned right lime the license plate mounting holes are in the middle vice closer top”
“And zero help on how to put it together”
“Not usable”