nes thread repair tool
Skip itBrand-locked demand (top 5 brands take 100% of clicks) — this niche doesn't clear our bar today.
Growth
Incredible+284.5%90-day search growth — must beat 0% to launch
Review moat
Incredible66.38avg incumbent reviews — the moat a new listing must climb
Returns
Okay3.3%return rate — above 6% kills the launch gate
Quality gap
Okay4.5★avg incumbent rating — lower means beatable quality
Avg price
Okay$233.75avg listing price — sweet spot $15–$100
Competition
Bad73%top-5 click share — a locked-up shelf
Market size
Bad$87K$87K/yr · 24K searches
Conversion
Bad1.5%search→purchase rate — share of searches ending in a sale
Price range
Bad$33.14–$659.96cheapest to priciest tracked listing — scored on the share inside $15–$100
Brand share
Bad100%top-5 brand share — brand-locked demand
Competition
The top 5 products capture 73% of clicks — a locked-up shelf that new listings rarely crack.Brands
5 flat
Sellers
41
Top-5 brand share
100%
Open market
0%
- UTR34%
- Powerbuilt33%
- NES27%
- NES Thread Repair4%
- Materro3%
- Open — no brand owns it (0%)
Product shelf
Each bubble is one product — market share against review moat; bubble size tracks estimated sales, color grades how beatable the incumbent looks.
All 13 tracked products in this niche — three views at once, no toggling.
Top sellers
by 90-day click share
Powerbuilt Universal Thread Repair Tool 5/32 - 3/4 SAE / 4-19mm Metric Fixed Damaged Threads Tool - 643030ECE
Powerbuilt$33.144.4★76 rev
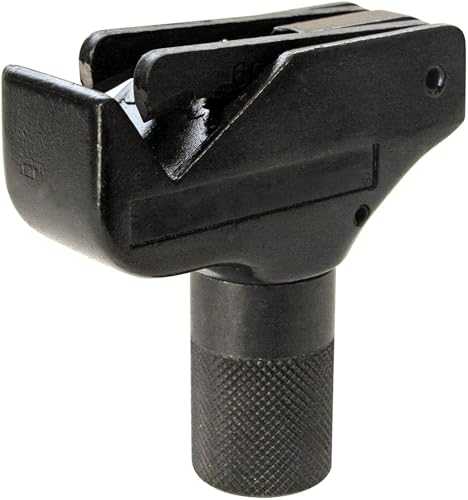
UTR TE1 Universal Thread Repair Tool. External Thread Restorer. Automatically chases and Repair Threads. Metric National Pipes All Threads Within Range 5/32 to 11/6 4-19 mm.
UTR$54.844.6★17 rev

Nes NES1025 Universal External/Internal Thread Repair Kit NES1A 2 21 22 23 24 6-Piece Orange
NES$568.794.6★70 rev

Nes Universal Internal Thread Repair Tool 5/16 to 7/16 NES21
NES$122.893.4★25 rev
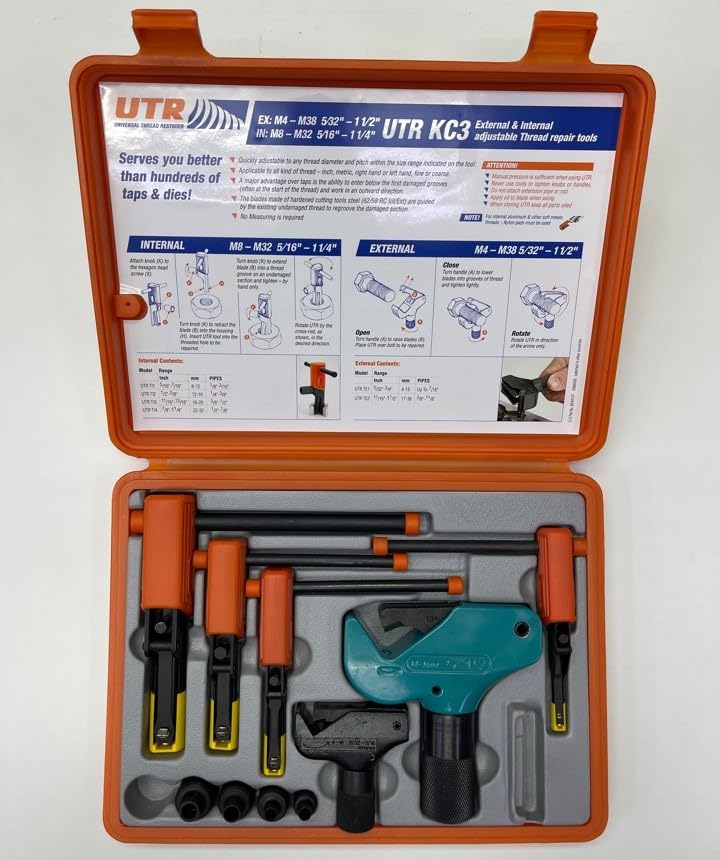
UTR KC3 - External & Internal Adjustable Restorers Universal Thread Repair Tool Kit. Easily Replaces Hundreds of Taps and Dies. All In One Patented Solution.
UTR$521.684.5★2 rev
Newest
by launch datePowerbuilt Universal Thread Repair Tool 5/32 - 3/4 SAE / 4-19mm Metric Fixed Damaged Threads Tool - 643030ECE
Powerbuilt$33.1476 rev
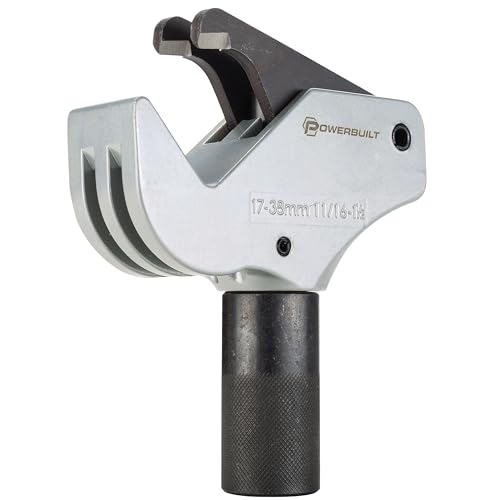
Powerbuilt Universal Thread Repair Tool 11/16 - 1-1/2 SAE / 17-38mm Metric - Fix Damaged Threads Tool - 643029ECE
Powerbuilt$45.2176 rev
UTR KC3 - External & Internal Adjustable Restorers Universal Thread Repair Tool Kit. Easily Replaces Hundreds of Taps and Dies. All In One Patented Solution.
UTR$521.682 rev
UTR TE1 Universal Thread Repair Tool. External Thread Restorer. Automatically chases and Repair Threads. Metric National Pipes All Threads Within Range 5/32 to 11/6 4-19 mm.
UTR$54.8417 rev

Nes Universal External Thread Repair Tool 11/16 to 1-1/2 NES2
NES$111.7490 rev
Trending
90-day click momentumPowerbuilt Universal Thread Repair Tool 11/16 - 1-1/2 SAE / 17-38mm Metric - Fix Damaged Threads Tool - 643029ECE
Powerbuilt$45.214.4★
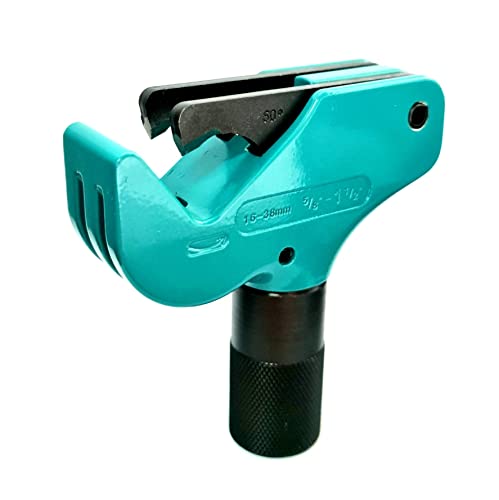
UTR TE2 Universal Thread Repair Tool. External Thread Restorer. Automatically chases and Repair Threads. Metric National Pipes All Threads Within Range 5/8 to 1-1/2 16-38 mm.
UTR$85.254.6★
Powerbuilt Universal Thread Repair Tool 5/32 - 3/4 SAE / 4-19mm Metric Fixed Damaged Threads Tool - 643030ECE
Powerbuilt$33.144.4★
UTR TE1 Universal Thread Repair Tool. External Thread Restorer. Automatically chases and Repair Threads. Metric National Pipes All Threads Within Range 5/32 to 11/6 4-19 mm.
UTR$54.844.6★
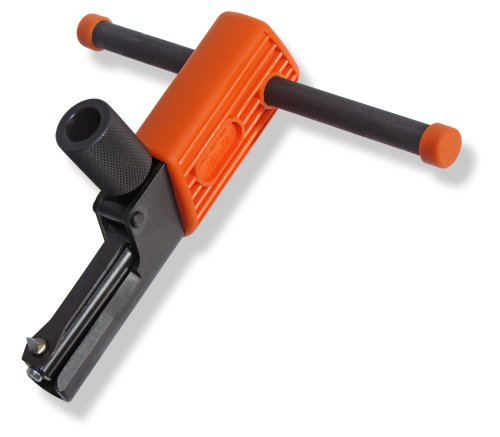
Int Thread Repair Tool 7/8-1 1/4 in
Materro$130.865.0★
Demand & seasonality
Weekly Amazon search volume, last 104 weeks — +284.5% search growth over the last 90 days.Peak months: May, Nov · busiest ÷ quietest = 9.5×
Reviews
What buyers praise and complain about, mined from review topics.What buyers love
“As advertised”
“This is a great quality set”
“Opens and closes smoothly”
“Money well spent”
“It grips well”
“This can save you from having to replace parts or go down the more expensive repair route”
What buyers complain about
“Does not work like advertised”
“they cake the paint on so heavily that nothing will thread on”
“Doesn't work”
“Im a union iron worker that always deals with nasty rust”
“does take some time and effort”