lift kit
Skip itPrices mostly outside the sweet spot ($17.17–$1157.31) — this niche doesn't clear our bar today.
Market size
Incredible$2.6M$2.6M/yr · 1.6M searches
Competition
Great24%top-5 click share — an open shelf
Review moat
Good635.02avg incumbent reviews — the moat a new listing must climb
Quality gap
Good4.4★avg incumbent rating — lower means beatable quality
Avg price
Okay$245.38avg listing price — sweet spot $15–$100
Returns
Okay4.8%return rate — above 6% kills the launch gate
Brand share
Okay86%top-5 brand share — brands hold most of the demand
Growth
Bad-22.0%90-day search growth — must beat 0% to launch
Conversion
Bad0.7%search→purchase rate — share of searches ending in a sale
Price range
Bad$17.17–$1157.31cheapest to priciest tracked listing — scored on the share inside $15–$100
Competition
Clicks spread well past the top 5 (24% combined) — an open shelf where new products get seen.Brands
19 falling
Sellers
30
Top-5 brand share
86%
Open market
11%
- Rough Country45%
- KSP PERFORMANCE16%
- dynofit12%
- MAXRACING10%
- MZS3%
- Richeer2%
- Open — no brand owns it (13 brands, 11%)
Product shelf
Each bubble is one product — market share against review moat; bubble size tracks estimated sales, color grades how beatable the incumbent looks.
All 92 tracked products in this niche — three views at once, no toggling.
Top sellers
by 90-day click share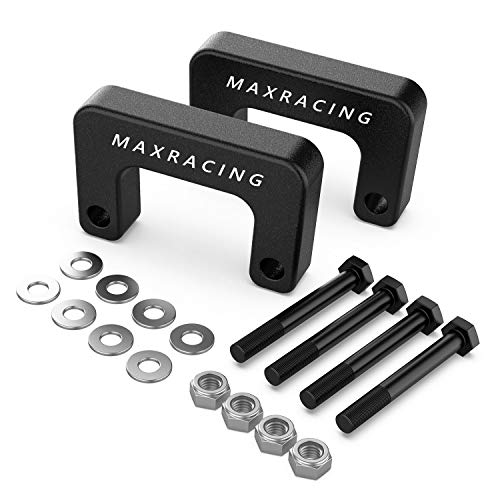
Maxracing 2 Leveling Kit Compatible with 2007-2026 Chevy Silverado 1500 Avalanche Suburban Tahoe/GMC Sierra Yukon XL1500
MAXRACING$34.244.6★3,008 rev

Rough Country 2 Leveling Kit for 2007-2018 Chevy/GMC 1500 | 07-21 SUV - 1307
Rough Country$33.104.6★4,000 rev
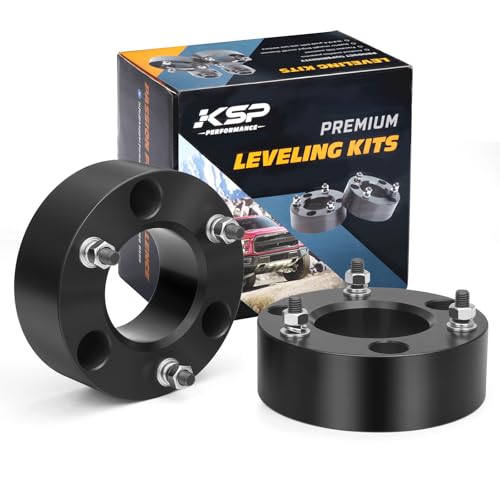
KSP 3 Front Leveling Kits for Silverado 1500 2WD/4WD 2007-2026 Sierra 2WD/4WD 2007-2026 3 Inch Suspension Strut Spacers Lift Kits for Pickup with 6 Lug
KSP PERFORMANCE$64.794.7★981 rev

Rough Country 2 Leveling Kit for Ford F-150 (2009-2026) & Ford Raptor (2017-2018) - Bolt-on Strut Spacer Fits up to 33 Tires
Rough Country$48.254.5★2,140 rev

Rough Country 1.5-2 Leveling Lift Kit for 99-06 Chevy/GMC 1500-28330
Rough Country$242.604.6★1,575 rev
Newest
by launch date
MTRPS 2 PCS Rubber Coil Spring Spacer for Car Heavy-Duty Front Rear Spacer Booster for 1.45-1.65 Springs Spacing Universal Coil Springs Lift Spacers for Enhancing Spring Rate (B)
MTRPS$17.1728 rev
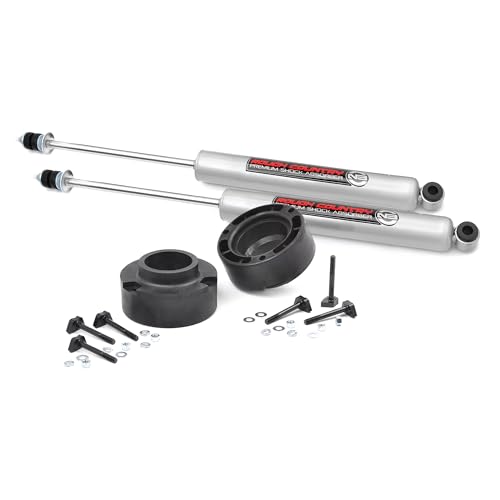
Rough Country 2.5 Leveling Kit with N3 Shock Absorbers for Dodge Ram 1500 (1994-2001) 2500 (1994-2013) 3500 (1994-2012) 4WD Models
Rough Country$161.4725 rev
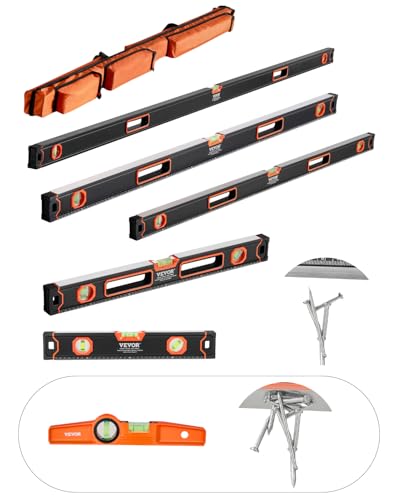
VEVOR 6-Piece Torpedo Level 78/48/32/24/16/10 Inch Box Levels Set Bubble Vials Ruler for 45/90/180 Degree Shock-Proof Aluminum Alloy Magnetic Leveler Tool SAE/Metric Scale(Only 10-inch has magnet)
VEVOR$78.09370 rev
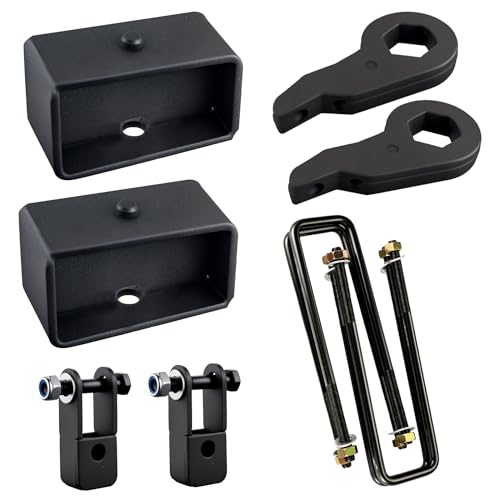
EVIL ENERGY 1-3 Front and 3 Rear Leveling Lift Kit Compatible With 1999-2007 Chevy Silverado 1500 GMC Sierra 1500 4WD Suspension Strut Spacers Torsion Bar Keys with Shock Extenders Brackets Black
EVIL ENERGY$89.2017 rev
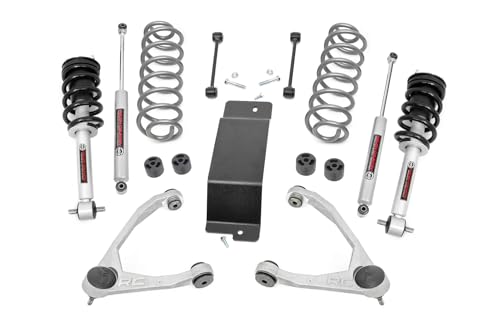
Rough Country 3.5 Lift Kit with N3 Struts & N3 Shocks for Chevy Avalanche Tahoe Suburban & GMC Yukon 1500 (2007-2020) - Aluminum Control Arms Up to 32 Tires
Rough Country$979.282 rev
Trending
90-day click momentum
Rough Country 3 Lift Kit w/N3 Struts & Shocks for 05-23 Toyota Tacoma - 74531
Rough Country$568.194.3★
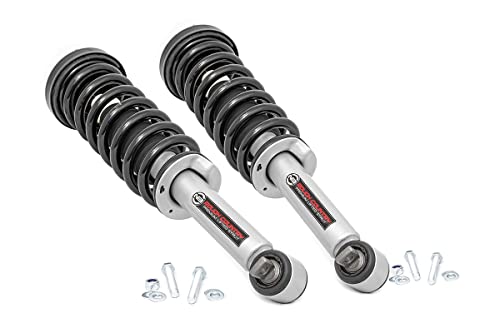
Rough Country Loaded N3 Leveling Struts for Ford F-150 4WD (2014-2025) 2 Lift - Pre-Loaded Coil Strut Bolt-on Install Set of 2
Rough Country$340.174.5★

Dynofit 2in Leveling Lift Kit for Dodge Ram 1500 4WD (2006-2026) Aluminum Strut Spacers Raise 2 Inches Front Suspension for Ram1500 4x4
dynofit$40.874.5★
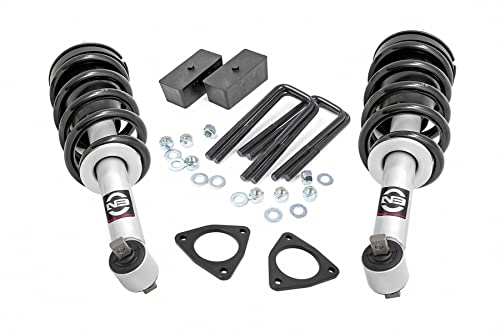
Rough Country 2.5 Leveling Lift Kit w/N3 Struts for 07-18 Chevy/GMC 1500-1319
Rough Country$433.754.7★
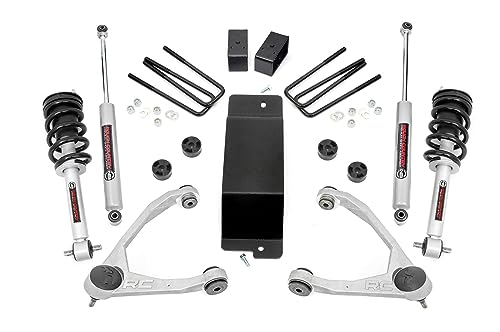
Rough Country 3.5 Lift Kit with N3 Loaded Struts/N3 Rear Shocks for Chevy Silverado & GMC Sierra 1500 (2014-2016) - Silver Control Arms
Rough Country$933.864.3★
Demand & seasonality
Weekly Amazon search volume, last 104 weeks — -22.0% search growth over the last 90 days.No pronounced peak months · busiest ÷ quietest = 1.3×
Reviews
What buyers praise and complain about, mined from review topics.What buyers love
“Really nice quality parts”
“Fast to install”
“Everything fit perfectly”
“Worth it”
“Worked as advertised”
“Works well”
“gave the perfect look I was looking for”
“Runs great for right now hasnt give me no problems”
“Made out of great material and very durable”
“Easy as can be”
What buyers complain about
“Garbage”
“Installation Failure”
“it does not fit my truck at all”
“Not as shown”
“Not compatible as advertised”
“Not working”
“Bad hardware”
“Installation instructions are not good either”
“Failure at 3 months”
“showing signs of rust”