jeep jk steering stabilizer
Skip itPrices mostly outside the sweet spot ($39.42–$379.36) — this niche doesn't clear our bar today.
Review moat
Good647.95avg incumbent reviews — the moat a new listing must climb
Avg price
Good$113.07avg listing price — sweet spot $15–$100
Quality gap
Good4.4★avg incumbent rating — lower means beatable quality
Competition
Okay56%top-5 click share — leaders hold, buyers still browse
Returns
Okay3.5%return rate — above 6% kills the launch gate
Brand share
Okay89%top-5 brand share — brands hold most of the demand
Conversion
Bad1.9%search→purchase rate — share of searches ending in a sale
Market size
Bad$92K$92K/yr · 43K searches
Growth
Bad-6.7%90-day search growth — must beat 0% to launch
Price range
Bad$39.42–$379.36cheapest to priciest tracked listing — scored on the share inside $15–$100
Competition
The top 5 products take 56% of clicks — established leaders, but buyers still shop beyond them.Brands
11 falling
Sellers
103
Top-5 brand share
89%
Open market
8%
- Rough Country63%
- maXpeedingrods7%
- Rancho7%
- TeraFlex6%
- FORDECO6%
- FOX Factory3%
- Open — no brand owns it (5 brands, 8%)
Product shelf
Each bubble is one product — market share against review moat; bubble size tracks estimated sales, color grades how beatable the incumbent looks.
All 22 tracked products in this niche — three views at once, no toggling.
Top sellers
by 90-day click share
Rough Country N3 Dual Steering Stabilizer for 07-18 Jeep Wrangler JK - 8734930
Rough Country$140.264.6★2,294 rev

Rough Country OE Replacement Stabilizer for 07-18 Jeep Wrangler JK - RC11318
Rough Country$39.424.3★276 rev

Rough Country N3 Steering Stabilizer for 2007-2018 Jeep Wrangler JK - 8730630
Rough Country$79.034.5★910 rev
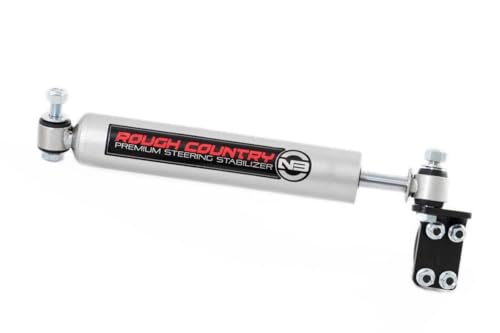
Rough Country N3 Steering Stabilizer Conversion Kit for 07-18 Jeep JK - 8731830
Rough Country$49.024.6★187 rev

Rough Country N3 Steering Stabilizer for Jeep TJ YJ XJ ZJ & GM - 8731730
Rough Country$40.084.7★6,178 rev
Newest
by launch date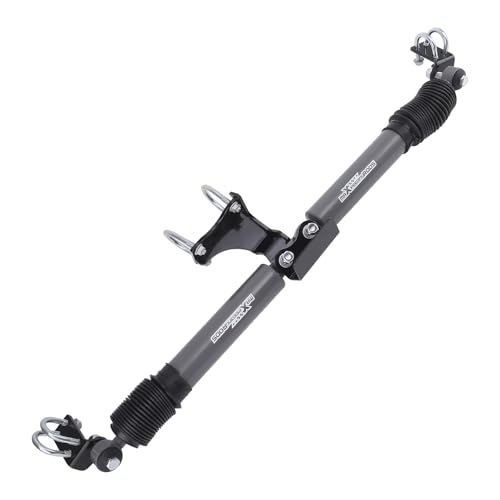
maXpeedingrods Dual Steering Stabilizer for 2007-2018 Jeep Wrangler JK JKU for 2 or More Suspension Lift G1 Upgraded Version
maXpeedingrods$114.305 rev
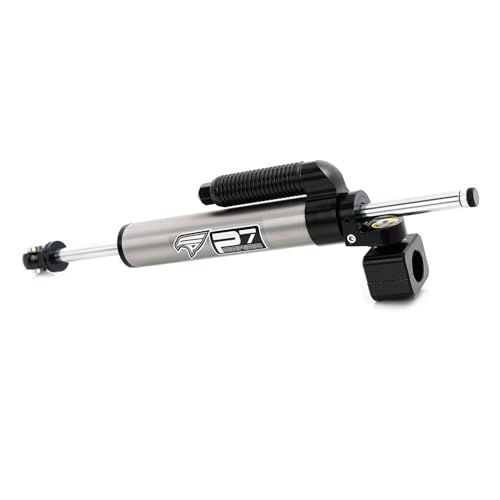
Steering Stabilizers for Jeep Wrangler JK 2007-2018
FAPO RACING$216.501 rev
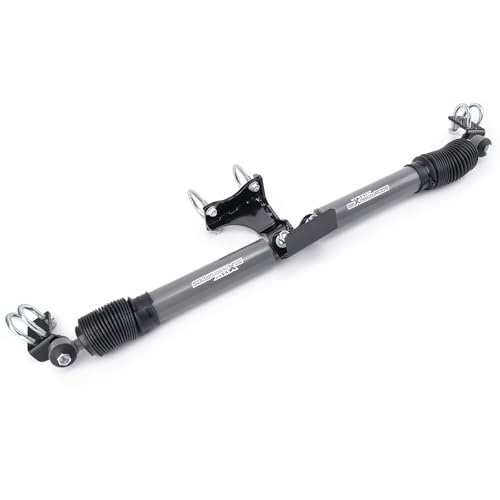
maXpeedingrods Dual Steering Stabilizer for Jeep Wrangler JK JKU 2007-2018 for 2 or More Suspension Lift G1 Upgraded Version
maXpeedingrods$115.3924 rev
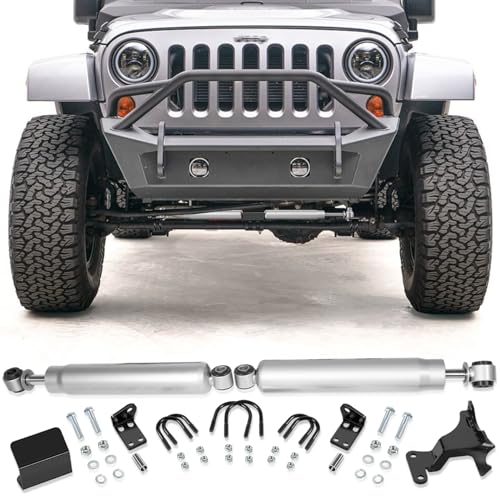
Dual Steering Stabilizer for Jeep Wrangler JK 07-18 N3 Double Steering Stabilizer Assembly for 2007-2018 Jeep Wrangler JK 2-Door and Unlimited 4-Door with 2 of Lift or Higher Replace for 8734930
Yoursme$104.1123 rev
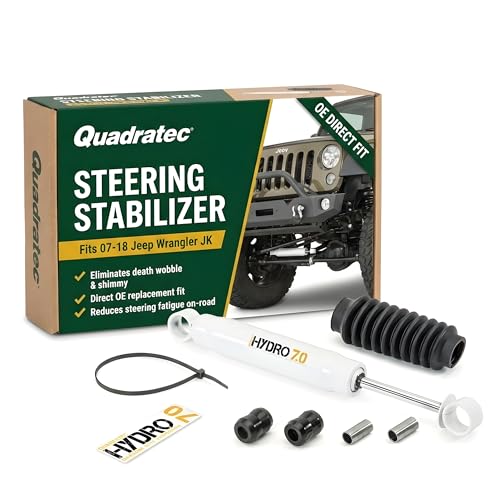
Quadratec OE Steering Stabilizer - Fits Jeep Wrangler JK & Unlimited 4-Door 2007-2018 - Built to Original Specifications - Plug & Play Replacement
Quadratec$59.203 rev
Trending
90-day click momentummaXpeedingrods Dual Steering Stabilizer for 2007-2018 Jeep Wrangler JK JKU for 2 or More Suspension Lift G1 Upgraded Version
maXpeedingrods$114.303.7★
Quadratec OE Steering Stabilizer - Fits Jeep Wrangler JK & Unlimited 4-Door 2007-2018 - Built to Original Specifications - Plug & Play Replacement
Quadratec$59.204.7★
Steering Stabilizers for Jeep Wrangler JK 2007-2018
FAPO RACING$216.505.0★
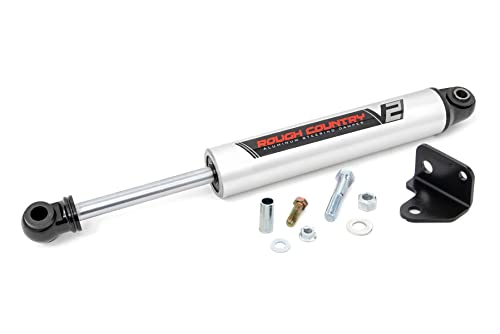
Rough Country V2 Steering Stabilizer for 2007-2018 Jeep Wrangler JK - 8730670
Rough Country$131.324.5★
maXpeedingrods Dual Steering Stabilizer for Jeep Wrangler JK JKU 2007-2018 for 2 or More Suspension Lift G1 Upgraded Version
maXpeedingrods$115.393.6★
Demand & seasonality
Weekly Amazon search volume, last 104 weeks — -6.7% search growth over the last 90 days.No pronounced peak months · busiest ÷ quietest = 1.4×
Reviews
What buyers praise and complain about, mined from review topics.What buyers love
“Fits perfect”
“Easy install”
“High-quality construction at an excellent price point”
“Good value”
“Helped the handling”
“shocks was great”
“Works as advertised”
“Durable, Reliable, Versatile, Heavy Duty”
“less wear on your components”
“Solid Front-End Stability”
What buyers complain about
“No instructions”
“But nothing I did could get the set up right with these”
“only lasted about a year”
“Doesn't work”
“Doesnt fit YJ”
“The quality of the parts are seriously lacking”
“Last two weeks have to warranty it shocks lost power”
“His description on top says the wrong thing, scroll down and you'll see the correct models”
“Leaks”
“one of the brackets bent”