jack stands 2 ton
Skip itBrand-locked demand (top 5 brands take 97% of clicks) — this niche doesn't clear our bar today.
Avg price
Incredible$30.09avg listing price — sweet spot $15–$100
Price range
Incredible$25.59–$37.86cheapest to priciest tracked listing — scored on the share inside $15–$100
Conversion
Good5.3%search→purchase rate — share of searches ending in a sale
Growth
Good+22.3%90-day search growth — must beat 0% to launch
Returns
Okay3.9%return rate — above 6% kills the launch gate
Review moat
Okay2,632.62avg incumbent reviews — the moat a new listing must climb
Quality gap
Bad4.7★avg incumbent rating — lower means beatable quality
Competition
Bad79%top-5 click share — a locked-up shelf
Market size
Bad$48K$48K/yr · 30K searches
Brand share
Bad97%top-5 brand share — brand-locked demand
Competition
The top 5 products capture 79% of clicks — a locked-up shelf that new listings rarely crack.Brands
7 falling
Sellers
15
Top-5 brand share
97%
Open market
2%
- BIG RED31%
- Jack Boss28%
- Amazon Basics28%
- YELLOW JACKET8%
- GAOLLY2%
- DNA MOTORING2%
- Open — no brand owns it (1 brand, 2%)
Product shelf
Each bubble is one product — market share against review moat; bubble size tracks estimated sales, color grades how beatable the incumbent looks.
All 13 tracked products in this niche — three views at once, no toggling.
Top sellers
by 90-day click share
Jack Boss Jack Stands Low Profile 2 Ton(4000 LBs) Lifting Car Stand Fit Use for Cars Automotive Small Vehicles 2 Pack
Jack Boss$29.294.7★1,828 rev

Amazon Basics Steel Jack Auto Stands 3 Ton (2.7 metric Ton) Capacity Easy to Use Adjustable Height 6 000 lb 1 Pair Black and Red(For Sedans and Urban SUVs)
Amazon Basics$28.844.7★13,046 rev

Big RED AT42002R-3 Torin Jack Stands (1 Pair): Exceptional Use for Cars Sedans and Most Automobiles - 2 Ton (4 000 lb.) Capacity Red
BIG RED$25.594.7★608 rev
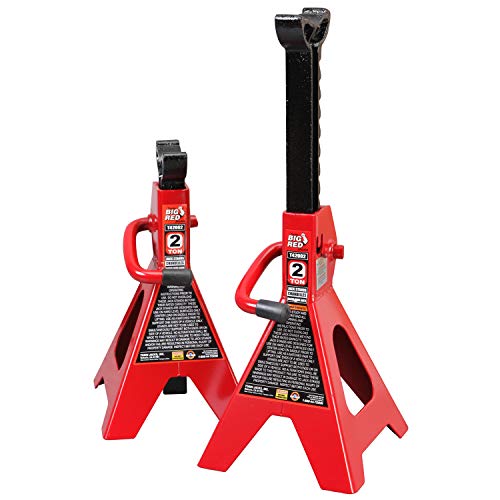
BIG RED T42202 Torin Steel Jack Stands: 2 Ton (4 000 lb) Capacity Red 1 Pair
BIG RED$28.854.6★2,427 rev

YELLOW JACKET 2 Ton Jack Stands with Double Locking and Large Foot Base for Lifting Car Heavy Duty Steel 4 400 lb Capacity Yellow 1 Pair
YELLOW JACKET$34.474.5★104 rev
Newest
by launch date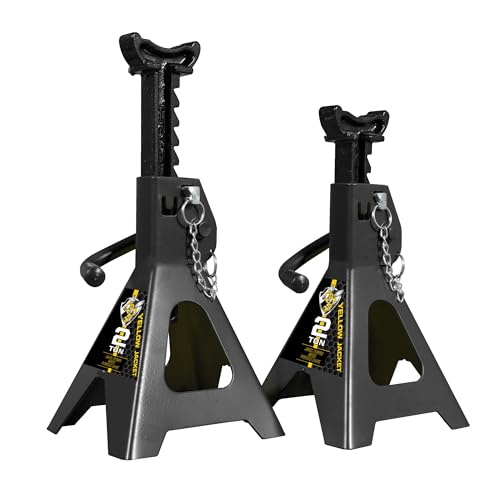
YELLOW JACKET Jack Stands 2 Ton with Double Locking for Lifting Car SUVS 4400 lb Capacity Heavy Duty Steel 1 Pair Black
YELLOW JACKET$32.9917 rev

GAOLLY Car Jack Stands 2 Ton with Double Locking and Large Foot Base for Lifting Cars SUVS MPVS Heavy Duty Steel 4400 lb Capacity 1 Pair Blue
GAOLLY$32.7492 rev
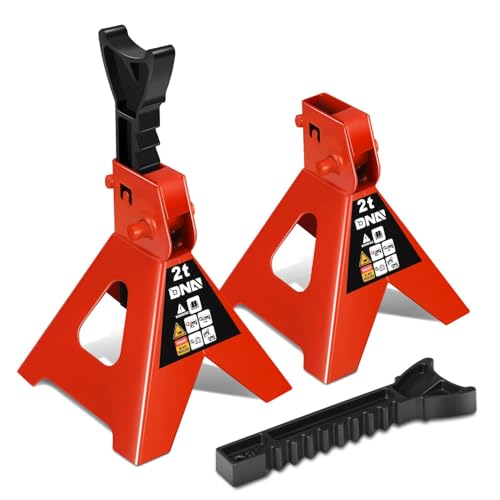
DNA Motoring 1 Pair Jack Stands 2 Ton (4400 lbs) Capacity Car Lifting Stand Adjustable Height Car Jack Stands for Cars Sedans Small Vehicles SUV TOOLS-00681-RD
DNA MOTORING$26.959 rev
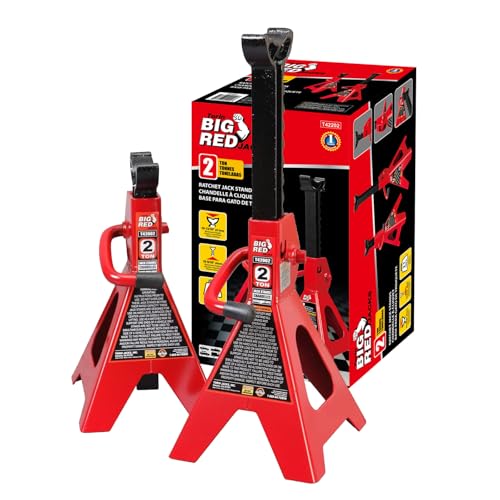
Big RED Torin Steel Jack Stands: 2 Ton (4 000 lb) Capacity Fit Use for Cars Automotive Small Vehicles Red 1 Pair
BIG RED$26.9111 rev
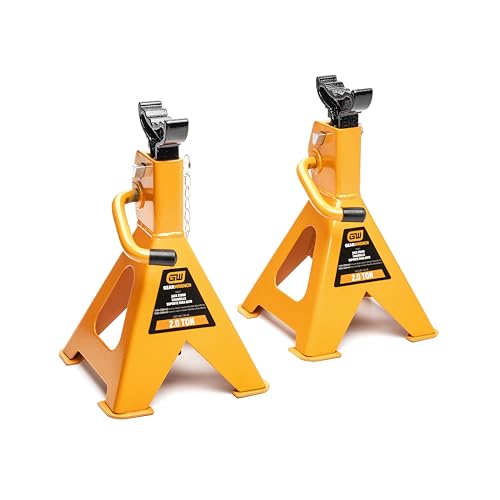
GEARWRENCH 2 Ton Ratcheting Jack Stands - Pack of 2 | GWJS2T
GEARWRENCH$37.867 rev
Trending
90-day click momentumDNA Motoring 1 Pair Jack Stands 2 Ton (4400 lbs) Capacity Car Lifting Stand Adjustable Height Car Jack Stands for Cars Sedans Small Vehicles SUV TOOLS-00681-RD
DNA MOTORING$26.954.5★
YELLOW JACKET Jack Stands 2 Ton with Double Locking for Lifting Car SUVS 4400 lb Capacity Heavy Duty Steel 1 Pair Black
YELLOW JACKET$32.994.7★
Big RED AT42002R-3 Torin Jack Stands (1 Pair): Exceptional Use for Cars Sedans and Most Automobiles - 2 Ton (4 000 lb.) Capacity Red
BIG RED$25.594.7★
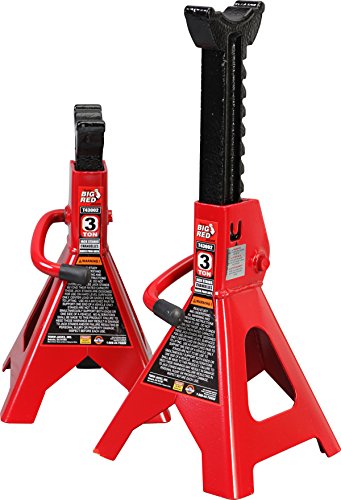
BIG RED T43202 Torin Heavy Duty Steel Jack Stands: 3 Ton (6 000 lb) Capacity Car Lifting Stand 1 Pair (Not Suitable for SUV Truck)
BIG RED$30.784.7★

Big RED AT42002R Torin Steel Car Jack Stands: 2 Ton (4 000 lb) Capacity Red 1 Pair
BIG RED$26.324.6★
Demand & seasonality
Weekly Amazon search volume, last 104 weeks — +22.3% search growth over the last 90 days.No pronounced peak months · busiest ÷ quietest = 1.4×
Reviews
What buyers praise and complain about, mined from review topics.What buyers love
“Build quality is solid”
“Great Value”
“Well built, well engineered”
“As advertised”
“Very sturdy and durable”
“Worked perfectly”
“Just the right size for the golf cart”
“easy to use”
“Built well”
“do the job very well”
What buyers complain about
“then they don't fit on the saddle”
“poor quality control”
“Not like the cheep ones very heavy duty”
“Ratchet bar top too thick”
“No information whatsoever regarding delivery”
“I wouldn't recommend using them at maximum extension”
“not brand new”
“Stuck and didnt work at all”
“Please use other supports”
“Appears to be excess paint”