hyper tough
Skip itA concentrated shelf (top 5 take 84% of clicks) — this niche doesn't clear our bar today.
Avg price
Incredible$27.63avg listing price — sweet spot $15–$100
Price range
Great$11.65–$53.78cheapest to priciest tracked listing — scored on the share inside $15–$100
Growth
Great+66.9%90-day search growth — must beat 0% to launch
Quality gap
Good4.4★avg incumbent rating — lower means beatable quality
Conversion
Good4.7%search→purchase rate — share of searches ending in a sale
Review moat
Okay1,648.1avg incumbent reviews — the moat a new listing must climb
Returns
Okay3.8%return rate — above 6% kills the launch gate
Market size
Okay$118K$118K/yr · 91K searches
Brand share
Bad90%top-5 brand share — brand-locked demand
Competition
Bad84%top-5 click share — a locked-up shelf
Competition
The top 5 products capture 84% of clicks — a locked-up shelf that new listings rarely crack.Brands
9 falling
Sellers
29
Top-5 brand share
90%
Open market
6%
- nlkvilla29%
- Generic24%
- ANWNOEER17%
- WETOOLPLUS13%
- Hyper Tough8%
- Tongshcorp4%
- Open — no brand owns it (3 brands, 6%)
Product shelf
Each bubble is one product — market share against review moat; bubble size tracks estimated sales, color grades how beatable the incumbent looks.
All 10 tracked products in this niche — three views at once, no toggling.
Top sellers
by 90-day click share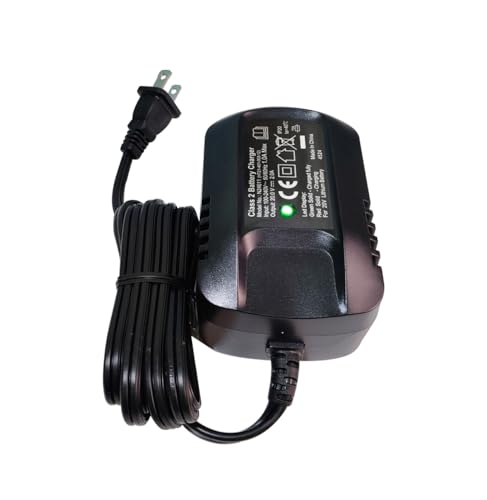
for Hyper Tough 20V 2A Lithium-Ion Battery Fast Charger with LED Indicator Light US Plug HT21-401-003-12
nlkvilla$25.844.5★184 rev
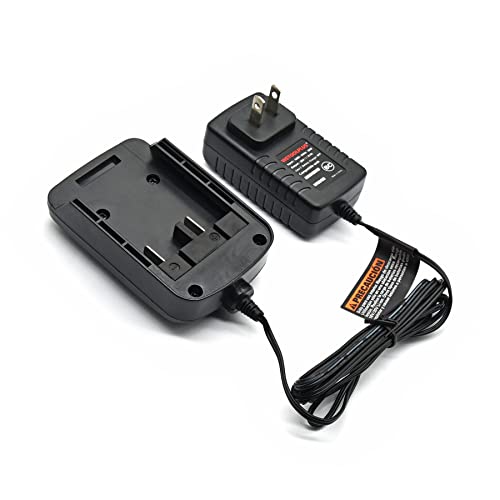
WETOOLPLUS 20V 0.7A Battery Charger for Hyper Tough Slow Replacement Charger Compatible with 20V Max Lithium-Ion Batteries (Charger Model: ACG318W1U | Fits Battery: HT21-401-003-10 / HY5601050516015)
Generic$25.574.6★273 rev
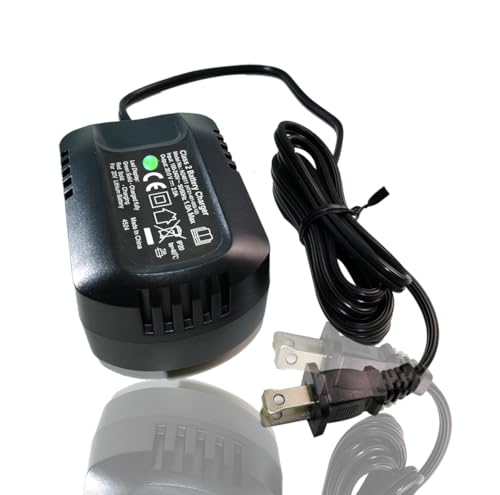
for Hyper Tough 20V Fast Lithium Battery Charger Compatible with Hyper Tough 20v Battery AQ90051G HT21-401-003-11...
ANWNOEER$26.004.3★82 rev

Hyper Tough HT Charge Lithium-Ion Fast Charger 20v MAX
Hyper Tough$53.784.5★441 rev
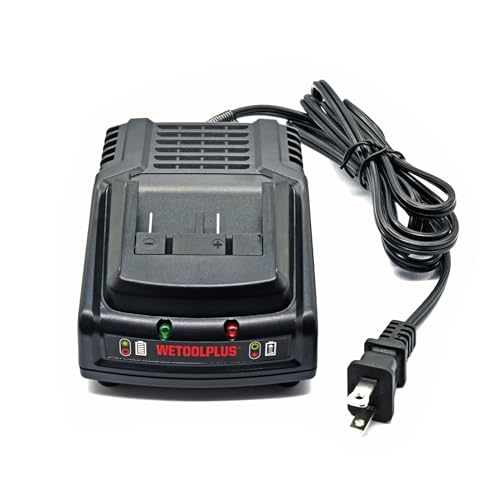
WETOOLPLUS 20V 3A Fast Charger for Hyper Tough Battery 20v Compatible with HyperTough Battery Charger HT19-401-003-13&HT21-401-003-12
WETOOLPLUS$39.954.5★173 rev
Newest
by launch date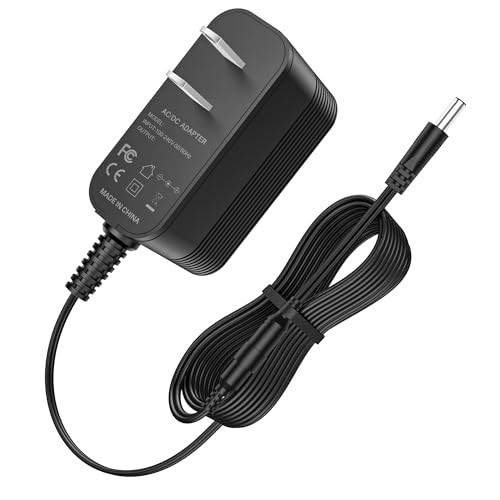
9V Power Supply for Hyper Tough Battery Charger AQ75072G AQ75046G 8 Volt Cordless Drill 8V Lithium Ion Li-Ion Screwdriver Compatible with EOBAR Power EBS0075C-0900500AUA HT HT06-0900500U
XHUCHINMAL$11.6516 rev

20Volt Battery Charger Replacement for Black and Decker 20V MAX Lithium Charger LCS1620B Compatible with Black & Decker 12V/20V MAX Battery LBXR20 LBXR20-OPE LB20 LBX20 LBX4020 LB2X4020-OPE
Tongshcorp$13.9489 rev
for Hyper Tough 20V Fast Lithium Battery Charger Compatible with Hyper Tough 20v Battery AQ90051G HT21-401-003-11...
ANWNOEER$26.0082 rev
for Hyper Tough 20V 2A Lithium-Ion Battery Fast Charger with LED Indicator Light US Plug HT21-401-003-12
nlkvilla$25.84184 rev
WETOOLPLUS 20V 3A Fast Charger for Hyper Tough Battery 20v Compatible with HyperTough Battery Charger HT19-401-003-13&HT21-401-003-12
WETOOLPLUS$39.95173 rev
Trending
90-day click momentum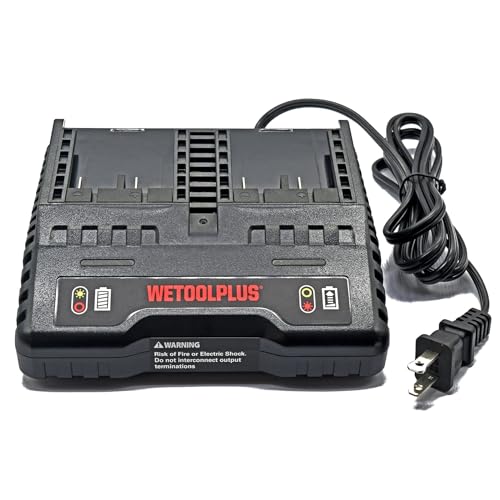
WETOOLPLUS 20V 1-Hour Fast Dual Charger for Hyper Tough Battery 20v Compatible with Hyper Tough Battery Charger HT19-401-003-14 HT21-401-003-13
WETOOLPLUS$44.884.5★
Hyper Tough HT Charge Lithium-Ion Fast Charger 20v MAX
Hyper Tough$53.784.5★
WETOOLPLUS 20V 0.7A Battery Charger for Hyper Tough Slow Replacement Charger Compatible with 20V Max Lithium-Ion Batteries (Charger Model: ACG318W1U | Fits Battery: HT21-401-003-10 / HY5601050516015)
Generic$25.574.6★
20Volt Battery Charger Replacement for Black and Decker 20V MAX Lithium Charger LCS1620B Compatible with Black & Decker 12V/20V MAX Battery LBXR20 LBXR20-OPE LB20 LBX20 LBX4020 LB2X4020-OPE
Tongshcorp$13.944.1★
9V Power Supply for Hyper Tough Battery Charger AQ75072G AQ75046G 8 Volt Cordless Drill 8V Lithium Ion Li-Ion Screwdriver Compatible with EOBAR Power EBS0075C-0900500AUA HT HT06-0900500U
XHUCHINMAL$11.654.0★
Demand & seasonality
Weekly Amazon search volume, last 104 weeks — +66.9% search growth over the last 90 days.Peak months: May · busiest ÷ quietest = 2.0×
Reviews
What buyers praise and complain about, mined from review topics.What buyers love
“Fast charger”
“It's a great quality replacement piece at a great price”
“It worked as advertised”
“the battery lasts longer than ever before”
“Exact fit”
“Great value for the price”
“Easy to use”
“Steady”
“Worked”
“Durability”
What buyers complain about
“Did not charge battery at all”
“Would not fully charge a battery”
“Not compatible”
“It did not fit”
“never shows 100%”
“Did not work”
“its waste of money”
“Two plug sizes, neither worked”