engine leveler
Skip itPrices mostly outside the sweet spot ($25.46–$1985.03) — this niche doesn't clear our bar today.
Review moat
Great359.28avg incumbent reviews — the moat a new listing must climb
Conversion
Good4.9%search→purchase rate — share of searches ending in a sale
Market size
Good$414K$414K/yr · 54K searches
Avg price
Good$157.06avg listing price — sweet spot $15–$100
Returns
Good2.9%return rate — above 6% kills the launch gate
Competition
Okay60%top-5 click share — leaders hold, buyers still browse
Quality gap
Okay4.5★avg incumbent rating — lower means beatable quality
Brand share
Okay84%top-5 brand share — brands hold most of the demand
Growth
Okay+7.4%90-day search growth — must beat 0% to launch
Price range
Bad$25.46–$1985.03cheapest to priciest tracked listing — scored on the share inside $15–$100
Competition
The top 5 products take 60% of clicks — established leaders, but buyers still shop beyond them.Brands
12 rising
Sellers
42
Top-5 brand share
84%
Open market
11%
- BIG RED34%
- YELLOW JACKET29%
- Orion Motor Tech10%
- Oberg Tilt Lift5%
- OTC5%
- WINMAX TOOLS AUTOMOTIVE5%
- Open — no brand owns it (6 brands, 11%)
Product shelf
Each bubble is one product — market share against review moat; bubble size tracks estimated sales, color grades how beatable the incumbent looks.
All 18 tracked products in this niche — three views at once, no toggling.
Top sellers
by 90-day click share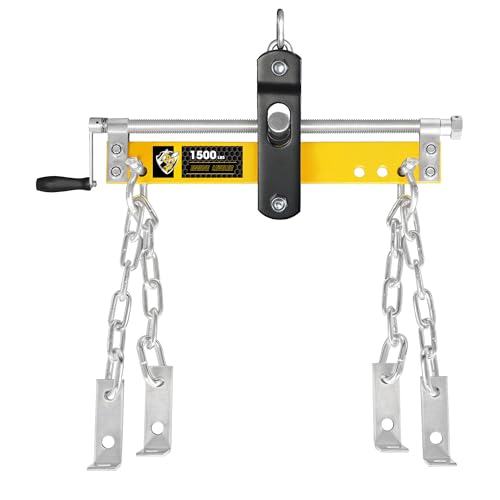
YELLOW JACKET Engine Hoist Shop Crane Engine Leveler 1500lbs Steel with Ball Bearing and Adjustable Handle
YELLOW JACKET$45.684.6★171 rev

BIG RED T32100 Torin Engine Hoist Shop Crane Accessory: Steel 3 Position Engine Leveler with Adjustable Handle 3/4 Ton (1 500 lb) Capacity Red
BIG RED$33.984.6★4,584 rev

YELLOW JACKET Engine Load Leveler 1500lbs Steel Engine Hoist Shop Crane Accessory with Adjustable Handle
YELLOW JACKET$33.754.6★107 rev
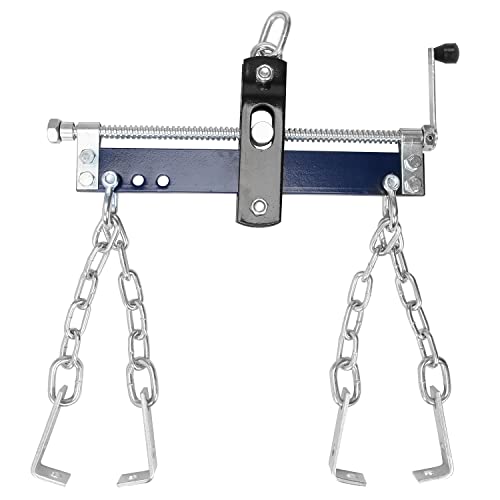
Big RED AT32100UR Engine Hoist Shop Crane Accessory: Steel 3 Position Engine Leveler with Adjustable Handle 3/4 Ton (1 500 lb) Blue
BIG RED$32.134.6★289 rev
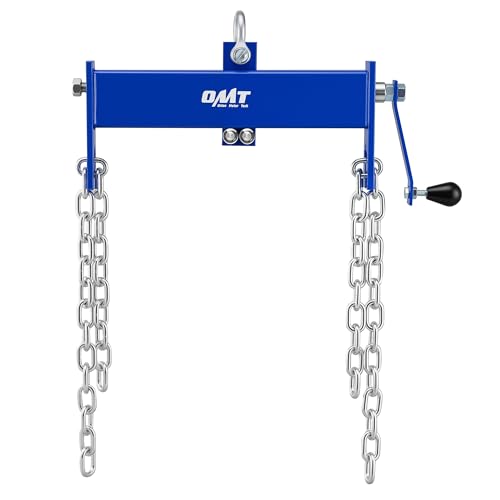
Orion Motor Tech Engine Load Leveler 2 Ton 4000 lb Capacity Heavy Duty Engine Hoist Load Leveler with 2 Adjustable Chains Shop Crane Cherry Picker Leveler Engine Lifting Leveling Tool
Orion Motor Tech$64.274.4★315 rev
Newest
by launch date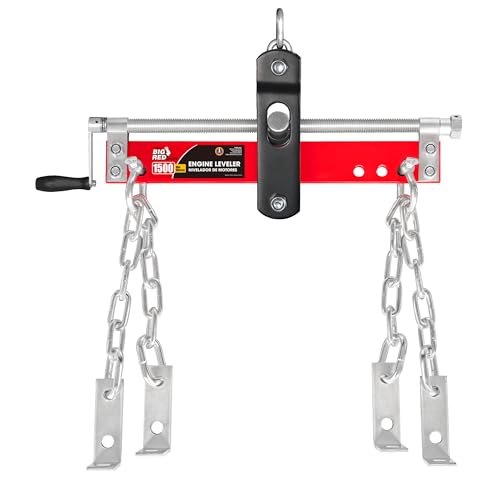
Big RED Engine Hoist Shop Crane Accessory Steel 3 Position 3/4 Ton (1500 lbs) Engine Load Leveler with Long Adjustable Handle
BIG RED$42.042 rev
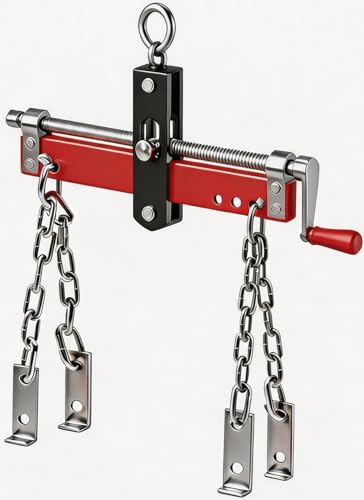
DEXSO Engine Hoist Shop Crane Engine Leveler 1500lbs Steel with Ball Bearing and Adjustable Handle Red
DEXSO$38.901 rev
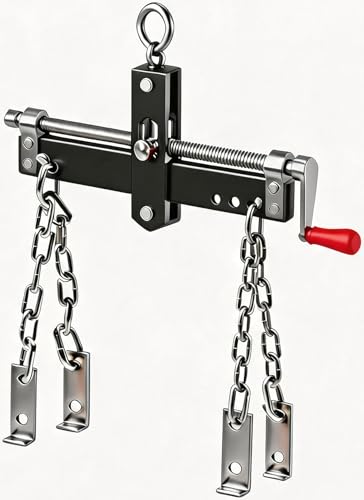
DEXSO Engine Hoist Shop Crane Engine Leveler 1500lbs Steel with Ball Bearing and Adjustable Handle Black
DEXSO$38.701 rev
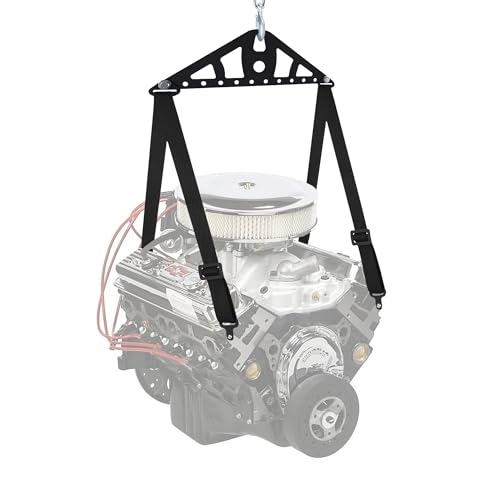
ZNZMAIO Engine Lifting Sling Kit 2 or 4 Point Hoist 1200 lb Capacity
ZNZMAIO$53.2011 rev

WINMAX TOOLS AUTOMOTIVE 4000 LBS Engine Hoist Load Leveler Shop Crane Cherry Picker with 2 Chains Steel Chain Hoist for up to 2 Ton
WINMAX TOOLS AUTOMOTIVE$39.5721 rev
Trending
90-day click momentumDEXSO Engine Hoist Shop Crane Engine Leveler 1500lbs Steel with Ball Bearing and Adjustable Handle Black
DEXSO$38.705.0★
Big RED Engine Hoist Shop Crane Accessory Steel 3 Position 3/4 Ton (1500 lbs) Engine Load Leveler with Long Adjustable Handle
BIG RED$42.044.5★
DEXSO Engine Hoist Shop Crane Engine Leveler 1500lbs Steel with Ball Bearing and Adjustable Handle Red
DEXSO$38.905.0★
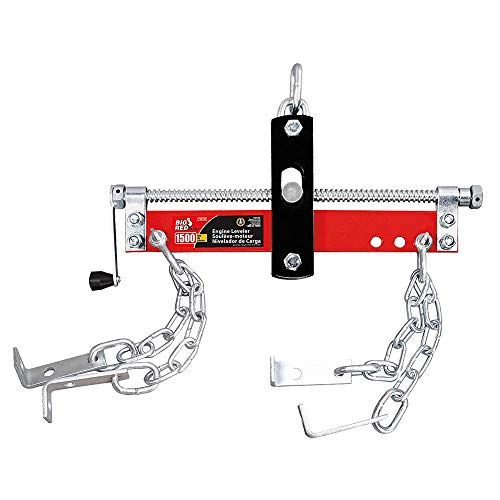
Big RED Torin Engine Load Leveler 3/4 Ton (1 500 lb) Engine Hoist Shop Crane Accessory with Adjustable Handle Steel 3 Position Engine Leveler Red
BIG RED$25.464.1★
ZNZMAIO Engine Lifting Sling Kit 2 or 4 Point Hoist 1200 lb Capacity
ZNZMAIO$53.204.9★
Demand & seasonality
Weekly Amazon search volume, last 104 weeks — +7.4% search growth over the last 90 days.No pronounced peak months · busiest ÷ quietest = 1.4×
Reviews
What buyers praise and complain about, mined from review topics.What buyers love
“This is a well made product overall”
“Definitely worth buying”
“works well”
“Works as advertised”
“Best engine hoist I have ever used”
“Very handy to have on hand”
“Adjust so you can tilt”
“Makes engine removal/installation so much easier”
“Works as designed”
“Good tool”
What buyers complain about
“Broke first time I tried to use it”
“Caused by poor engineering or quality control”
“Short chains,”
“poor design, parts quaulity poor”
“won't move stick in one position now”
“had to bend handle to operate”
“May be difficult to repair”
“Chain is far too light for the rated capacity”
“Dont trust it for safety”
“Complete waste of time and money”