back bumper
Worth a lookShows no brand lock-in (top 5 brands take 33% of clicks), but weak search conversion (0.3%) keeps it on the watch list.
Brand share
Incredible33%top-5 brand share — no brand owns this niche
Review moat
Great118.33avg incumbent reviews — the moat a new listing must climb
Competition
Great22%top-5 click share — an open shelf
Quality gap
Great4.1★avg incumbent rating — lower means beatable quality
Market size
Good$479K$479K/yr · 756K searches
Returns
Okay3.7%return rate — above 6% kills the launch gate
Avg price
Okay$204.28avg listing price — sweet spot $15–$100
Growth
Bad-21.9%90-day search growth — must beat 0% to launch
Price range
Bad$5.43–$713.77cheapest to priciest tracked listing — scored on the share inside $15–$100
Conversion
Bad0.3%search→purchase rate — share of searches ending in a sale
Competition
Clicks spread well past the top 5 (22% combined) — an open shelf where new products get seen.Brands
51 falling
Sellers
107
Top-5 brand share
33%
Open market
62%
- PM PERFORMOTOR9%
- YZONA8%
- ECOTRIC6%
- Auto Dynasty6%
- TUSDAR5%
- D SOLUTIONS5%
Product shelf
Each bubble is one product — market share against review moat; bubble size tracks estimated sales, color grades how beatable the incumbent looks.
All 123 tracked products in this niche — three views at once, no toggling.
Top sellers
by 90-day click share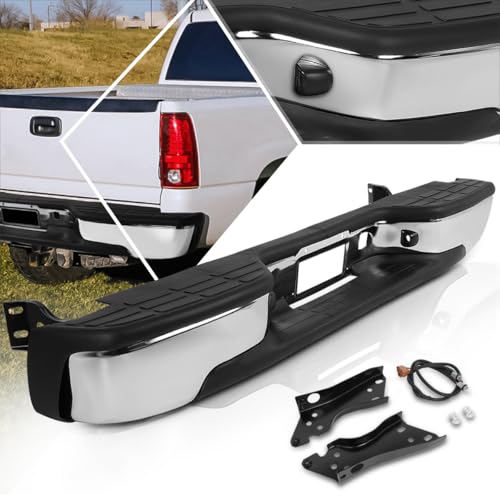
PM PERFORMOTOR Rear Step Bumper with License Plate Lights Compatible with 1999-2006 Chevy Silverado/GMC Sierra 1500 2500 Direct Replacement for GM1103124 GM1103122 12496085
PM PERFORMOTOR$116.744.1★236 rev
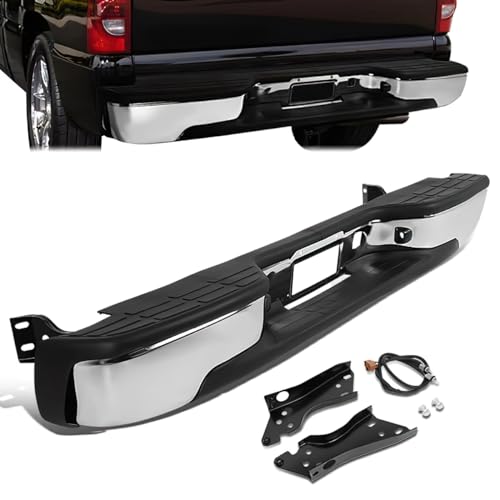
Rear Step Bumper Compatible with 99-07 Chevy Silverado 1500 2500 Compatible with GMC Sierra 1500 2500 1999-2007 Fleetside Steel Bumper Cover without Parking Sensor Holes Chrome GM1103122 12496085
D SOLUTIONS$95.763.8★81 rev
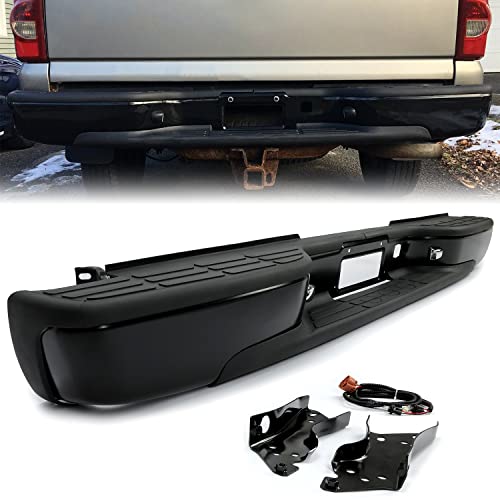
ECOTRIC Rear Step Bumper Compatible with 1999-2007 Chevy Chevrolet Silverado GMC Sierra 1500 2500 Classic Face Bar W/License Plate Lights Replace for GM1103122 12496085 GM1103124 Powder Coated Black
ECOTRIC$133.144.3★652 rev
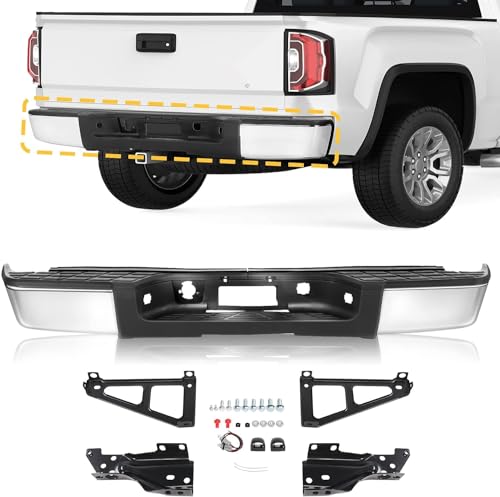
AutoForever Rear Step Bumper Assembly
AutoForever$168.364.2★74 rev
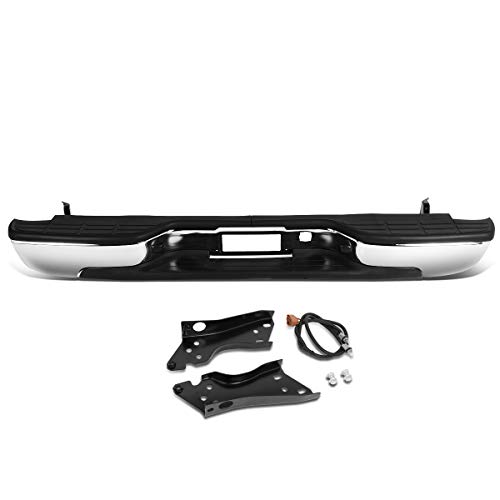
DNA MOTORING Rear Step Bumper w/License Plate Lights Compatible with 99-06 Silverado Sierra 1500/99-04 Silverado Sierra 2500 Chrome Black 12496085 GM1103122 ZTL-Y-0043
DNA MOTORING$120.554.1★257 rev
Newest
by launch date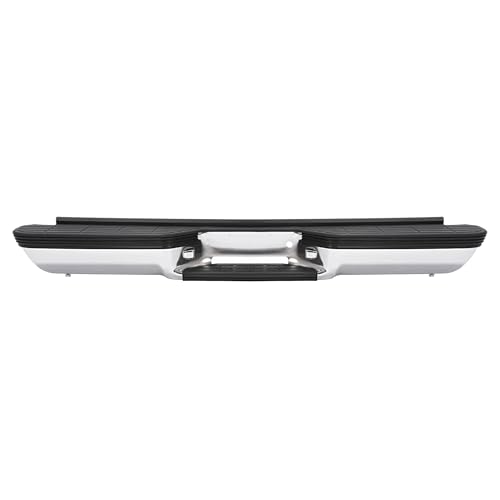
ALMULOO Rear Bumper Assembly Compatible with 1988-2000 Chevy Chevrolet GMC Suburban C/K C1500 C2500 C3500 K1500 K2500 K3500 Tahoe Yukon Blazer W/Strip Pad GM1101109 999863
ALMULOO$172.041 rev
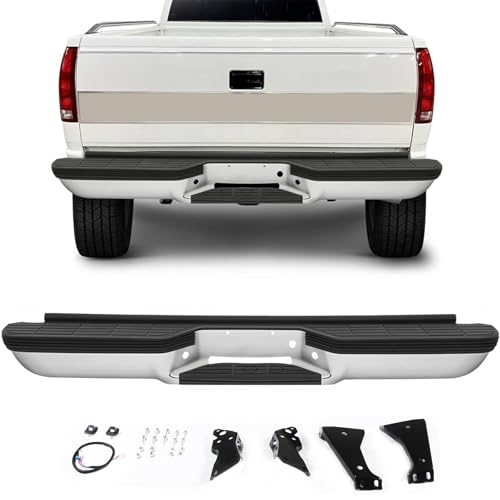
Rear Step Bumper Assembly Fit for 1988-2000 Chevy Silverado GMC Sierra C1500 C2500 K1500 K2500 W/Strip Fleetside/Styleside Chrome Steel Back Bumper without Parking Sensor Holes Replace for GM1101109
Winwayroadfit$117.841 rev
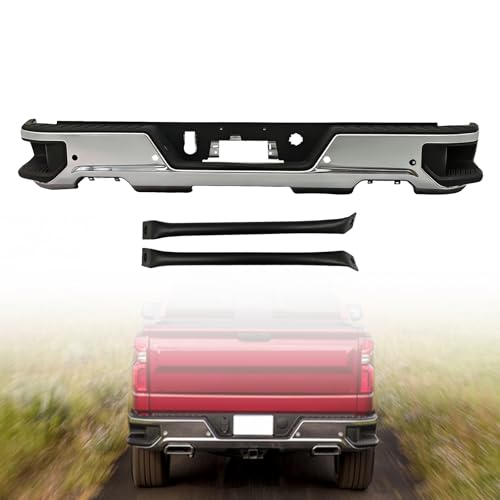
LAFORMO Rear Step Bumper Assembly for 2019-2024 Chevy Silverado 1500 | Chrome Steel with Dual Exhaust with Park Assist Holes | for Dual Exhaust Models Only | Replaces GM1103219
LAFORMO$284.140 rev
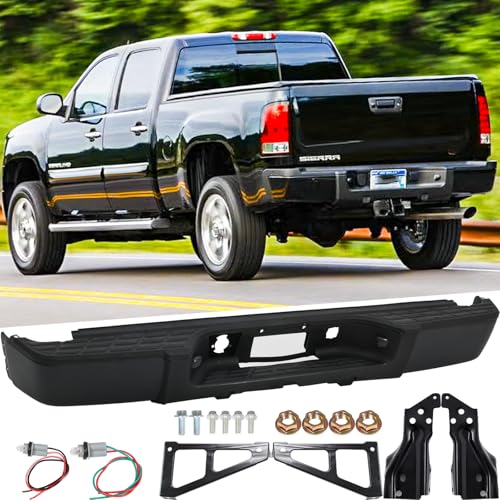
Rear Steel Step Bumper Assembly for 2007-2013 Chevy Silverado 1500 & GMC Sierra 1500 without Park Sensor Holes Black Back Bumper Replacement for GM1103159 with Pads Brackets and License Plate Lights
SAFAUTOPARTS$174.881 rev
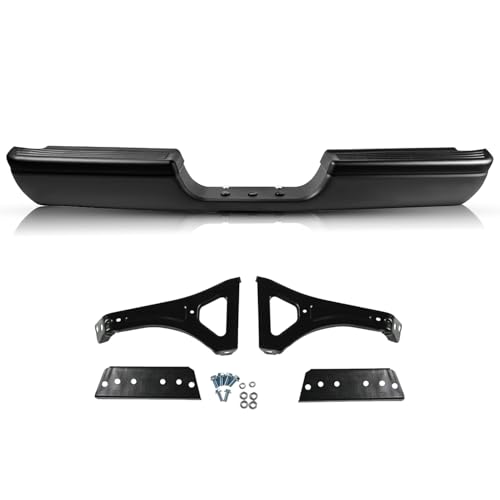
JSBOYAT Black Steel Rear Bumper Assembly for 1994-2002 Dodge Ram 1500 2500 3500 Pickup Heavy Duty Back Bumpers Replacement
JSBOYAT$96.386 rev
Trending
90-day click momentum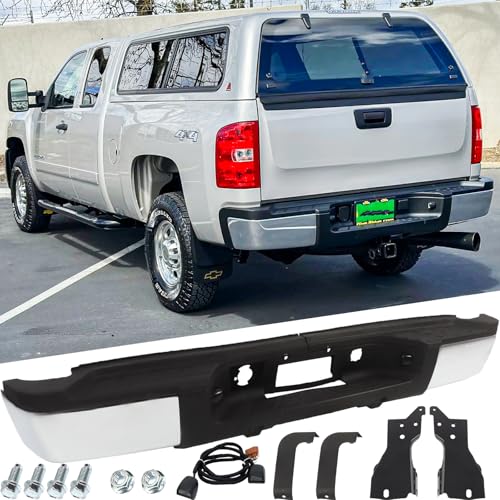
Rear Steel Step Bumper Assembly for 2011-2014 Chevy Silverado/GMC Sierra 2500 3500 HD without Park Sensor Holes Chrome Back Bumper Replacement for GM1103164 with Pads Brackets and License Plate Lights
SAFAUTOPARTS$251.074.6★
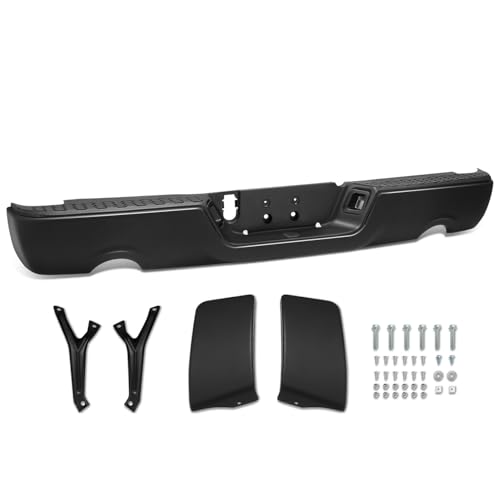
Rear Step Bumper Compatible with 2009-2018 Dodge Ram 1500 & 2019 Ram 1500 Classic with Dual Exhaust Holes fits models w/o Backup Sensors Black Steel
PM PERFORMOTOR$176.303.3★
ALMULOO Rear Bumper Assembly Compatible with 1988-2000 Chevy Chevrolet GMC Suburban C/K C1500 C2500 C3500 K1500 K2500 K3500 Tahoe Yukon Blazer W/Strip Pad GM1101109 999863
ALMULOO$172.044.0★
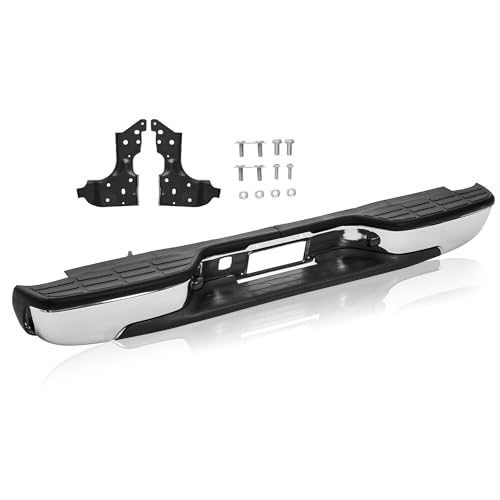
Rear Bumper Step Bumper Chrome compatible with 1999-2006 Chevy Silverado 1500 GMC Sierra 1500 07 Classic Model Non Sensor Hole
APSVE$120.533.8★
Rear Step Bumper Assembly Fit for 1988-2000 Chevy Silverado GMC Sierra C1500 C2500 K1500 K2500 W/Strip Fleetside/Styleside Chrome Steel Back Bumper without Parking Sensor Holes Replace for GM1101109
Winwayroadfit$117.845.0★
Demand & seasonality
Weekly Amazon search volume, last 104 weeks — -21.9% search growth over the last 90 days.No pronounced peak months · busiest ÷ quietest = 1.4×
Reviews
What buyers praise and complain about, mined from review topics.What buyers love
“Fit great”
“Excellent product”
“Worth it”
“This item has been installed”
“As advertised”
“Pretty happy with the way it looks”
“its much lighter than origanal”
“looked durable”
“Easy to put on”
“A lot more solid than I expected it to be”
What buyers complain about
“Poor quality”
“Doesn't fit”
“Rust fast”
“Mounting holes align with nothing”
“Can't Install”
“Metal seems thinner”
“NOT worth it”
“No instructions”
“Metal is much thinner than a oem bumper”
“the plastics are crap”