alpha one gen 1 impeller kit
Skip itA small market ($21K/yr) — this niche doesn't clear our bar today.
Growth
Incredible+298.1%90-day search growth — must beat 0% to launch
Avg price
Incredible$38.57avg listing price — sweet spot $15–$100
Price range
Incredible$24.05–$59.98cheapest to priciest tracked listing — scored on the share inside $15–$100
Conversion
Great7.7%search→purchase rate — share of searches ending in a sale
Review moat
Good510.88avg incumbent reviews — the moat a new listing must climb
Returns
Okay3.3%return rate — above 6% kills the launch gate
Quality gap
Bad4.7★avg incumbent rating — lower means beatable quality
Competition
Bad89%top-5 click share — a locked-up shelf
Brand share
Bad97%top-5 brand share — brand-locked demand
Market size
Bad$21K$21K/yr · 7K searches
Competition
The top 5 products capture 89% of clicks — a locked-up shelf that new listings rarely crack.Brands
6 falling
Sellers
37
Top-5 brand share
97%
Open market
0%
- GHmarine54%
- Quicksilver20%
- LucaSng14%
- SeaSierra5%
- AUTOBABA4%
- DynaVim Parts3%
Product shelf
Each bubble is one product — market share against review moat; bubble size tracks estimated sales, color grades how beatable the incumbent looks.
All 8 tracked products in this niche — three views at once, no toggling.
Top sellers
by 90-day click share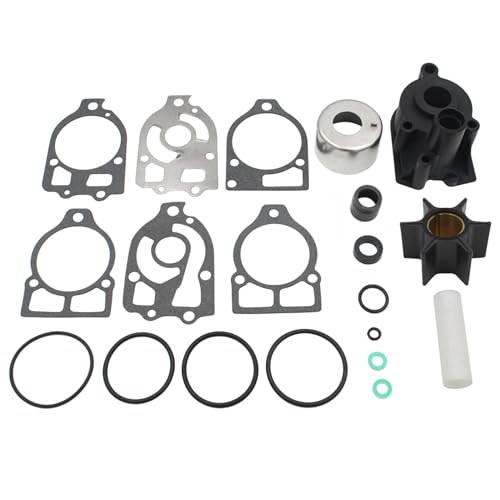
GHmarine 96148A8 Water Pump Impeller Kit Compatible with MerCruiser alpha one gen 1 Stern Drives 46-96148A8 96148Q8
GHmarine$30.454.6★531 rev
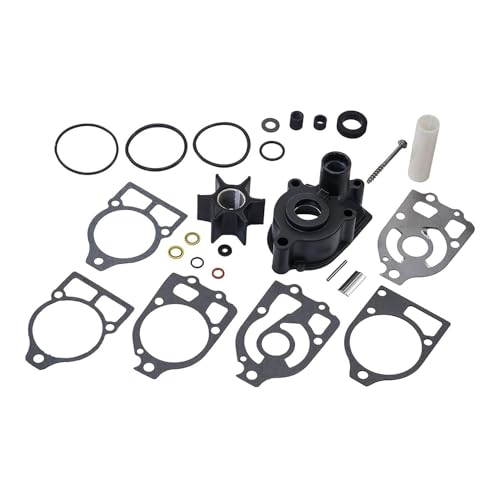
Quicksilver 96148Q8 Water Pump Repair Kit for Mercury and Mariner Outboards and MerCruiser Stern Drives
Quicksilver$59.984.7★1,167 rev
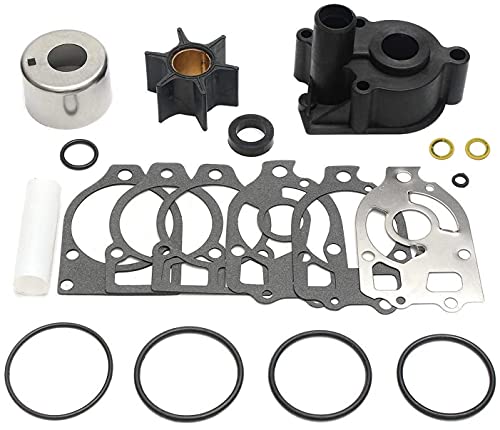
LucaSng 46-96148A8 Alpha One Gen 1 Water Pump Kit Replacement Fit for Mercruiser 46-96148Q8 and 2-Stroke Outboards
LucaSng$27.394.7★168 rev
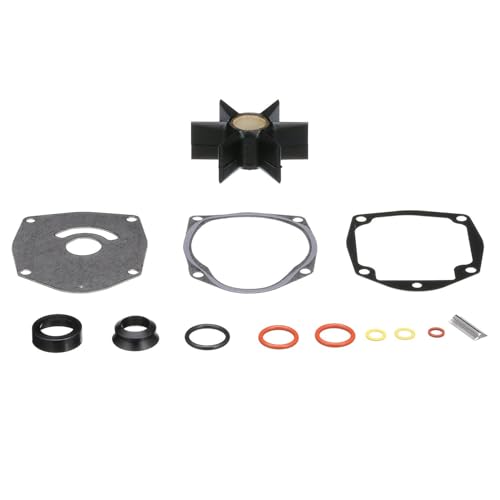
Quicksilver by Mercury Marine 8M0100526 Water Pump Repair Kit for Mercury or Mariner Outboards and MerCruiser Sterndrives
Quicksilver$52.894.8★1,698 rev
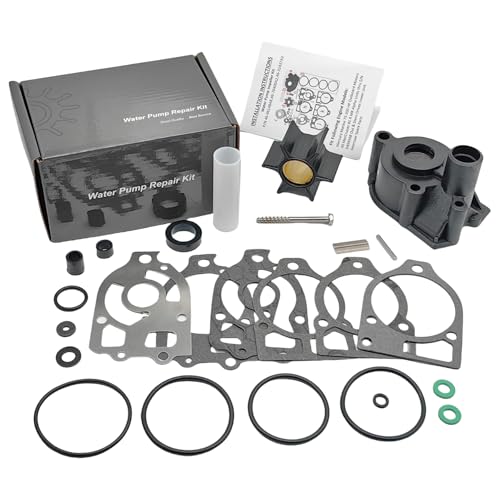
96148A8 Water Pump Impeller Repair Kit Compatible with Mercruiser Alpha One 1 Gen 1 Stern Drive Replace 96148Q8
SeaSierra$35.254.5★14 rev
Newest
by launch date96148A8 Water Pump Impeller Repair Kit Compatible with Mercruiser Alpha One 1 Gen 1 Stern Drive Replace 96148Q8
SeaSierra$35.2514 rev
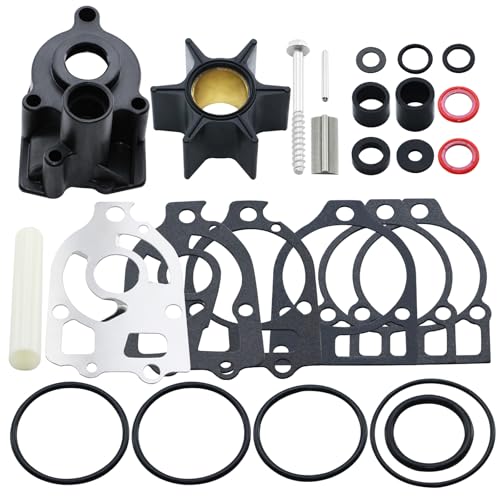
96148Q8 Water Pump Impeller Repair Kit for Mercury 2-Stroke Outboard and MerCruiser Alpha One Gen 1 Stern Drives 46-96148A8 46-96148Q8 96148A8 18-3217 Water Pump Kit for Mercury Mariner Outboard
DynaVim Parts$31.6330 rev
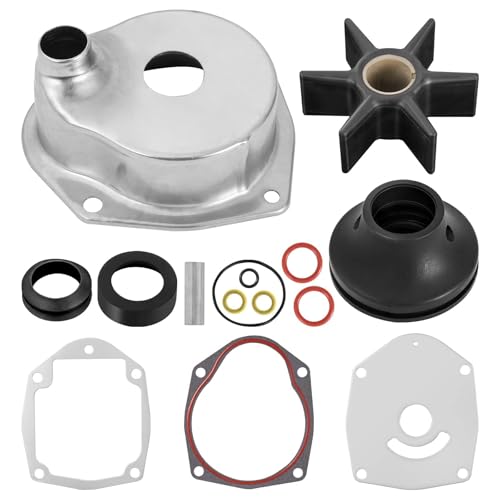
AUTOBABA Water Pump Repair Kit Compatible with 1991-2021 Mercury MerCruiser Alpha 1 Gen 2 Drives Water Pump Impeller Repair Replace 817275A4 817275Q05 18-3147 47-43026-1 47-43026-2
AUTOBABA$46.94117 rev
LucaSng 46-96148A8 Alpha One Gen 1 Water Pump Kit Replacement Fit for Mercruiser 46-96148Q8 and 2-Stroke Outboards
LucaSng$27.39168 rev
GHmarine 96148A8 Water Pump Impeller Kit Compatible with MerCruiser alpha one gen 1 Stern Drives 46-96148A8 96148Q8
GHmarine$30.45531 rev
Trending
90-day click momentum
GHmarine 43026Q06 Water Pump Impeller Kit for MerCruiser Alpha 1 Gen 2 Sterndrives Replacement 47-43026Q06 8M0100526
GHmarine$24.054.6★
GHmarine 96148A8 Water Pump Impeller Kit Compatible with MerCruiser alpha one gen 1 Stern Drives 46-96148A8 96148Q8
GHmarine$30.454.6★
96148A8 Water Pump Impeller Repair Kit Compatible with Mercruiser Alpha One 1 Gen 1 Stern Drive Replace 96148Q8
SeaSierra$35.254.5★
Quicksilver by Mercury Marine 8M0100526 Water Pump Repair Kit for Mercury or Mariner Outboards and MerCruiser Sterndrives
Quicksilver$52.894.8★
Quicksilver 96148Q8 Water Pump Repair Kit for Mercury and Mariner Outboards and MerCruiser Stern Drives
Quicksilver$59.984.7★
Demand & seasonality
Weekly Amazon search volume, last 104 weeks — +298.1% search growth over the last 90 days.Peak months: May, Jun, Jul, Aug · busiest ÷ quietest = 19.7×
Reviews
What buyers praise and complain about, mined from review topics.What buyers love
“Fit perfect”
“Worked as advertised”
“Best done as a two man job”
“a great value for the money”
“Worked good”
“Great kit”
What buyers complain about
“Pretty useless kit if there are no other parts that are shown”
“Orings are not the correct size”
“Much heavier than after market”