8-14.5 trailer tire
Worth a lookShows low returns (0.0%), but prices mostly outside the sweet spot ($65.90–$490.34) keeps it on the watch list.
Returns
Incredible0.0%return rate — above 6% kills the launch gate
Review moat
Great109.63avg incumbent reviews — the moat a new listing must climb
Quality gap
Great4.3★avg incumbent rating — lower means beatable quality
Market size
Good$463K$463K/yr · 66K searches
Growth
Good+21.7%90-day search growth — must beat 0% to launch
Avg price
Okay$237.42avg listing price — sweet spot $15–$100
Conversion
Okay2.9%search→purchase rate — share of searches ending in a sale
Competition
Bad72%top-5 click share — a locked-up shelf
Brand share
Bad95%top-5 brand share — brand-locked demand
Price range
Bad$65.90–$490.34cheapest to priciest tracked listing — scored on the share inside $15–$100
Competition
The top 5 products capture 72% of clicks — a locked-up shelf that new listings rarely crack.Brands
7 rising
Sellers
9
Top-5 brand share
95%
Open market
1%
- ZEEMAX41%
- Grandforce35%
- eCustomRim10%
- MERXENG5%
- REALLYCNC4%
- EliteEdge4%
- Open — no brand owns it (1 brand, 1%)
Product shelf
Each bubble is one product — market share against review moat; bubble size tracks estimated sales, color grades how beatable the incumbent looks.
All 16 tracked products in this niche — three views at once, no toggling.
Top sellers
by 90-day click share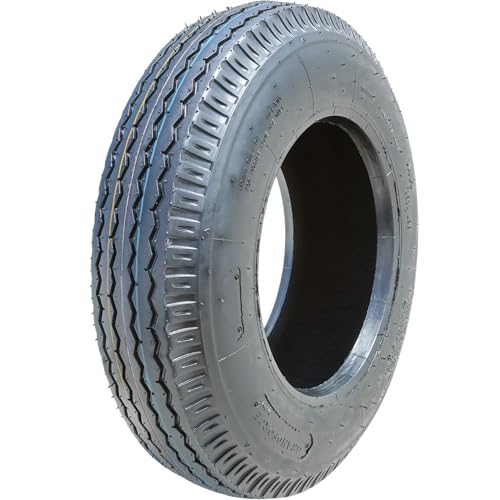
Grandforce GF704 Premium Mobile Home Trailer Tire-ST8-14.5 8X14.5 Load Range G LRG 14-Ply BSW Black Side Wall
Grandforce$65.904.4★141 rev
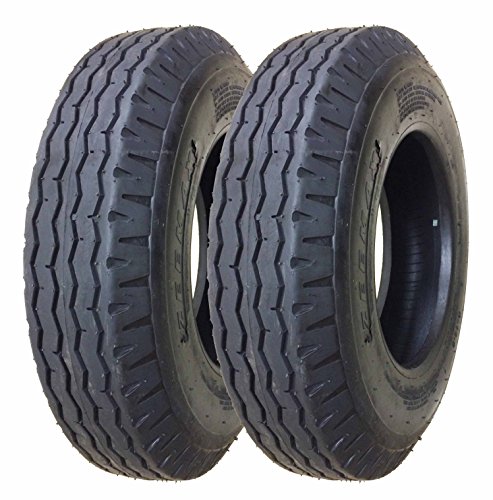
Zeemax Heavy Duty TRUE Highway Trailer Tires 8-14.5 14 Ply Load Range G Speed Rating K 68mph- Set 2
ZEEMAX$151.994.4★425 rev
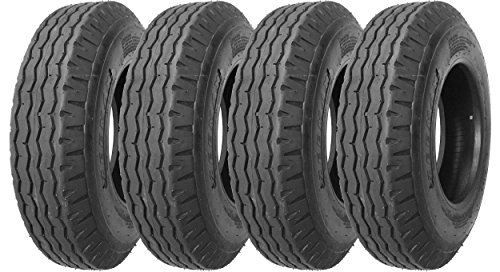
Zeemax Heavy Duty True Highway Trailer Tires 8-14.5 14 Ply Load Range G Speed Rating K 68mph- Set 4
ZEEMAX$326.134.4★379 rev
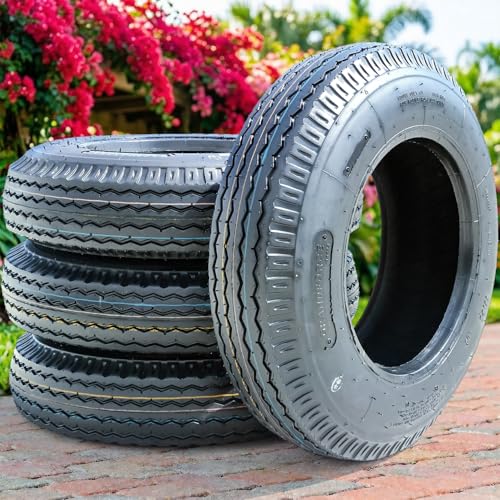
Set of 4 (FOUR) Grandforce GF704 Premium Mobile Home Trailer Tires-ST8-14.5 8X14.5 Load Range G LRG 14-Ply BSW Black Side Wall
Grandforce$265.822.5★3 rev

eCustomrim 2-Pack Heavy Duty Highway Trailer Tire 8-14.5 ST On 6X14.5 14.5X6 Wheel RV Mobile Home Load H 16 Ply w/ 2 Year Warranty and Roadside
eCustomRim$256.004.6★515 rev
Newest
by launch date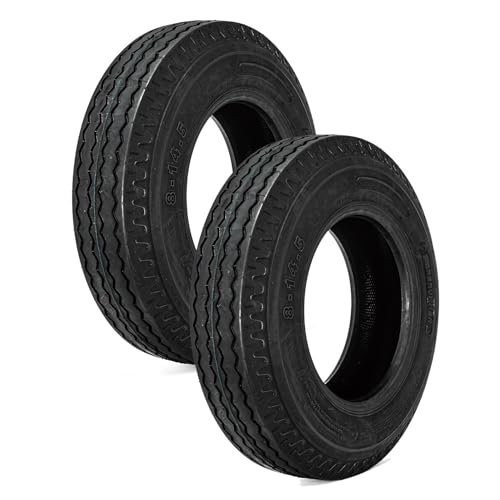
FORERUNNER 8-14.5 Heavy Duty Highway Trailer Tires (Pack of 2)
REALLYCNC$109.560 rev
Set of 4 (FOUR) Grandforce GF704 Premium Mobile Home Trailer Tires-ST8-14.5 8X14.5 Load Range G LRG 14-Ply BSW Black Side Wall
Grandforce$265.823 rev
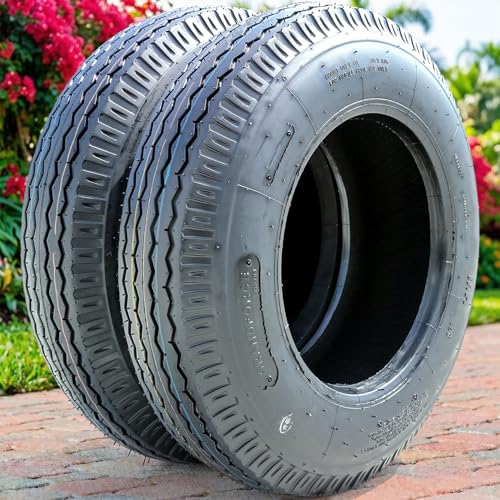
Set of 2 (TWO) Grandforce GF704 Premium Mobile Home Trailer Tires-ST8-14.5 8X14.5 Load Range G LRG 14-Ply BSW Black Side Wall
Grandforce$133.630 rev
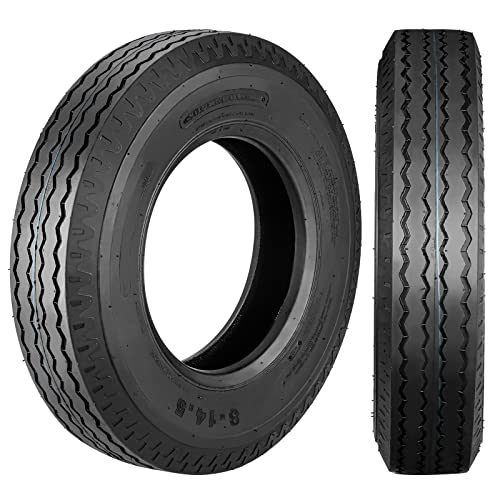
2 PCS 8-14.5 Trailer Tires 14PR Load Range G Heavy Duty Boat & Utility Trailer Tires 8 14.5 for Trailers Farm Equipment & Agricultural Towing (Rims Not Included)
TROPOW$129.710 rev

8-14.5 14PR Trailer Tire Set of 2 Heavy-Duty Trailer Tire Set All-Season & 12 Fuel Saving Design Fits Camper Cargo Horse Boat and Utility Trailers
EliteEdge$149.3114 rev
Trending
90-day click momentum2 PCS 8-14.5 Trailer Tires 14PR Load Range G Heavy Duty Boat & Utility Trailer Tires 8 14.5 for Trailers Farm Equipment & Agricultural Towing (Rims Not Included)
TROPOW$129.710.0★
FORERUNNER 8-14.5 Heavy Duty Highway Trailer Tires (Pack of 2)
REALLYCNC$109.560.0★
Set of 2 (TWO) Grandforce GF704 Premium Mobile Home Trailer Tires-ST8-14.5 8X14.5 Load Range G LRG 14-Ply BSW Black Side Wall
Grandforce$133.630.0★
Set of 4 (FOUR) Grandforce GF704 Premium Mobile Home Trailer Tires-ST8-14.5 8X14.5 Load Range G LRG 14-Ply BSW Black Side Wall
Grandforce$265.822.5★
8-14.5 14PR Trailer Tire Set of 2 Heavy-Duty Trailer Tire Set All-Season & 12 Fuel Saving Design Fits Camper Cargo Horse Boat and Utility Trailers
EliteEdge$149.314.2★
Demand & seasonality
Weekly Amazon search volume, last 102 weeks — +21.7% search growth over the last 90 days.No pronounced peak months · busiest ÷ quietest = 1.7×
Reviews
What buyers praise and complain about, mined from review topics.What buyers love
“Overall great quality product”
“Good tires and wheels”
“Just what I wanted and expected”
“good tire, good price”
“Perfect fit”
“FILLED RECOMENDED PRESSURE AND HAULED A LOAD JUST THAT EASY”
“Work great”
“are holding up well”
What buyers complain about
“The worst tires ever”
“Scam. We only received 2”
“While they are unused they are not new”
“This turned a three day tow into a week”
“Not worth it”