4000a jump starter
Skip itBrand-locked demand (top 5 brands take 100% of clicks) — this niche doesn't clear our bar today.
Market size
Incredible$4.8M$4.8M/yr · 405K searches
Conversion
Good4.3%search→purchase rate — share of searches ending in a sale
Returns
Okay3.2%return rate — above 6% kills the launch gate
Quality gap
Okay4.5★avg incumbent rating — lower means beatable quality
Avg price
Okay$277.77avg listing price — sweet spot $15–$100
Review moat
Bad19,214.5avg incumbent reviews — the moat a new listing must climb
Competition
Bad83%top-5 click share — a locked-up shelf
Growth
Bad-34.8%90-day search growth — must beat 0% to launch
Price range
Bad$89.67–$1074.80cheapest to priciest tracked listing — scored on the share inside $15–$100
Brand share
Bad100%top-5 brand share — brand-locked demand
Competition
The top 5 products capture 83% of clicks — a locked-up shelf that new listings rarely crack.Brands
2 falling
Sellers
45
Top-5 brand share
100%
Open market
0%
- NOCO66%
- Clore Automotive34%
- Open — no brand owns it (0%)
Product shelf
Each bubble is one product — market share against review moat; bubble size tracks estimated sales, color grades how beatable the incumbent looks.
All 12 tracked products in this niche — three views at once, no toggling.
Top sellers
by 90-day click share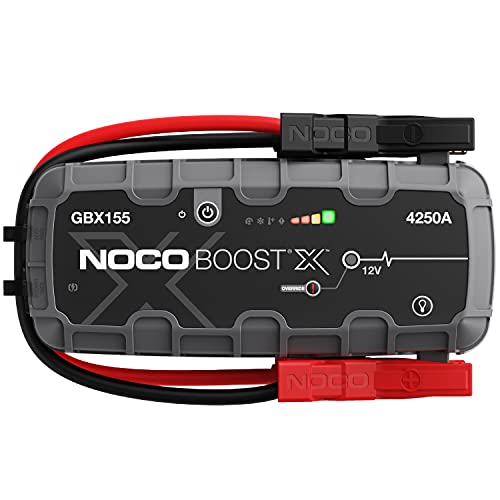
NOCO Boost X GBX155: 4250A UltraSafe Jump Starter 12V Lithium Battery Booster Pack Portable Jump Box Power Bank & Jumper Cables - for 10.0L Gas and 8.0L Diesel Engines
NOCO$335.734.2★7,088 rev
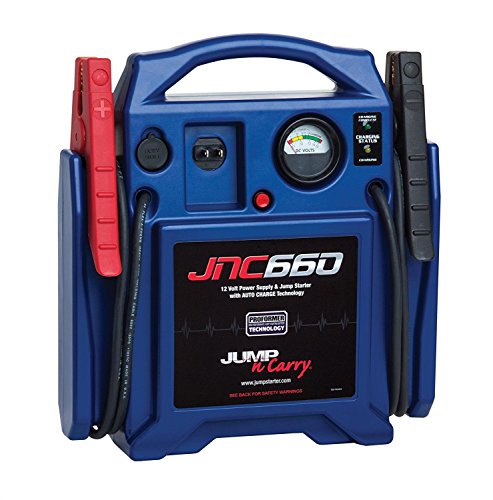
Clore Automotive Jump-N-Carry JNC660 1700 Peak Amp 12 Volt Jump Starter Blue
Clore Automotive$130.884.7★19,708 rev

NOCO Boost GB150: 3000A UltraSafe Jump Starter 12V Lithium Battery Booster Pack Portable Jump Box Power Bank & Jumper Cables - for 9.0L Gas and 7.0L Diesel Engines
NOCO$278.164.6★12,902 rev

Clore Automotive Jump-N-Carry JNC770R 1700 Peak Amp Premium 12 Volt Jump Starter - Red
Clore Automotive$154.094.6★5,374 rev
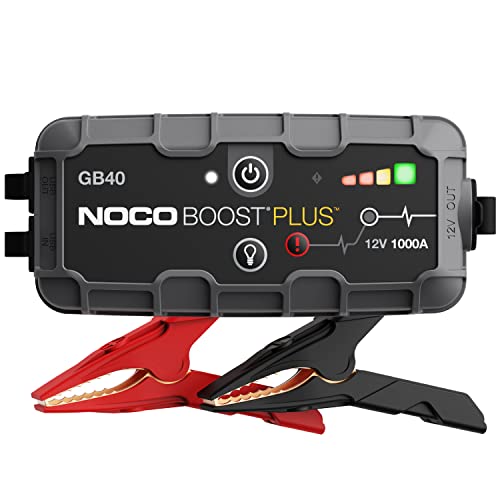
NOCO Boost GB40: 1000A UltraSafe Jump Starter 12V Lithium Battery Booster Pack Portable Jump Box Power Bank & Jumper Cables - for 6.0L Gas and 3.0L Diesel Engines
NOCO$89.674.6★127,790 rev
Newest
by launch date
NOCO Boost X GBX45: 1250A UltraSafe Jump Starter 12V Lithium Battery Booster Pack Portable Jump Box Power Bank & Jumper Cables - for 6.5L Gas and 4.0L Diesel Engines
NOCO$114.5915,068 rev
NOCO Boost X GBX155: 4250A UltraSafe Jump Starter 12V Lithium Battery Booster Pack Portable Jump Box Power Bank & Jumper Cables - for 10.0L Gas and 8.0L Diesel Engines
NOCO$335.737,088 rev

NOCO Boost X GBX55: 1750A UltraSafe Jump Starter 12V Lithium Battery Booster Pack Portable Jump Box Power Bank & Jumper Cables - for 7.5L Gas and 5.0L Diesel Engines
NOCO$154.694,286 rev

NOCO Boost X GBX75: 2500A UltraSafe Jump Starter 12V Lithium Battery Booster Pack Portable Jump Box Power Bank & Jumper Cables - for 8.5L Gas and 6.5L Diesel Engines
NOCO$221.515,563 rev

NOCO Boost Max GB250: 5250A UltraSafe Jump Starter 12V Lithium Battery Booster Pack Portable Jump Box Power Bank & Jumper Cables - for 16L Gas and Diesel Engines
NOCO$1074.80216 rev
Trending
90-day click momentumNOCO Boost X GBX55: 1750A UltraSafe Jump Starter 12V Lithium Battery Booster Pack Portable Jump Box Power Bank & Jumper Cables - for 7.5L Gas and 5.0L Diesel Engines
NOCO$154.694.5★

Clore Automotive Jump-N-Carry JNC1224 3400/1700 Peak Amp 12/24V Jump Starter
Clore Automotive$383.434.4★
NOCO Boost GB150: 3000A UltraSafe Jump Starter 12V Lithium Battery Booster Pack Portable Jump Box Power Bank & Jumper Cables - for 9.0L Gas and 7.0L Diesel Engines
NOCO$278.164.6★
Clore Automotive Jump-N-Carry JNC660 1700 Peak Amp 12 Volt Jump Starter Blue
Clore Automotive$130.884.7★
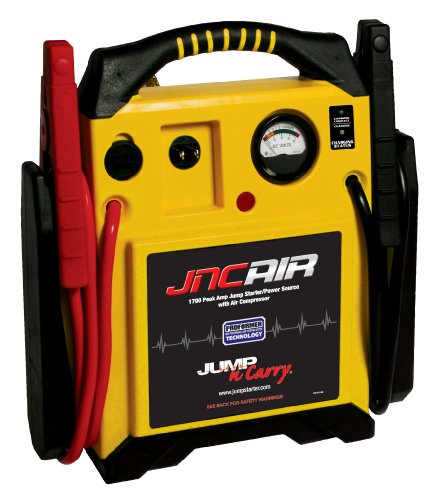
Clore Automotive Jump-N-Carry JNCAIR 1700 Peak Amp Jump Starter with Air Compressor
Clore Automotive$212.534.2★
Demand & seasonality
Weekly Amazon search volume, last 104 weeks — -34.8% search growth over the last 90 days.Peak months: Jan, Feb, Nov, Dec · busiest ÷ quietest = 2.2×
Reviews
What buyers praise and complain about, mined from review topics.What buyers love
“Excellent Product”
“Charges quickly”
“Easy to handle”
“Good price”
“It works great”
“The battery stays charged”
“As advertised”
“Sturdy”
“its been reliable”
“It is portable”
What buyers complain about
“DOES NOT HOLD A CHARGE”
“Battery is dead”
“Never worked”
“Broke almost immediately”
“Absolute Garbage”
“NO INSTRUCTIONS”
“Yes, there are other makers out there that make less expensive,”
“Very loose fit”
“Not as advertised”
“It's heavier than you think”