37 degree flaring tool
Skip itSoft demand (-8.5% this quarter) — this niche doesn't clear our bar today.
Review moat
Great107.65avg incumbent reviews — the moat a new listing must climb
Avg price
Good$107.24avg listing price — sweet spot $15–$100
Quality gap
Good4.4★avg incumbent rating — lower means beatable quality
Brand share
Okay76%top-5 brand share — brands hold most of the demand
Conversion
Okay3.8%search→purchase rate — share of searches ending in a sale
Returns
Okay3.9%return rate — above 6% kills the launch gate
Competition
Okay65%top-5 click share — leaders hold, buyers still browse
Market size
Okay$112K$112K/yr · 28K searches
Price range
Bad$21.87–$348.58cheapest to priciest tracked listing — scored on the share inside $15–$100
Growth
Bad-8.5%90-day search growth — must beat 0% to launch
Competition
The top 5 products take 65% of clicks — established leaders, but buyers still shop beyond them.Brands
12 falling
Sellers
72
Top-5 brand share
76%
Open market
18%
- Performance Tool29%
- DPTOOL17%
- RIDGID13%
- Speedway Motors10%
- Mastercool6%
- LainKeen6%
Product shelf
Each bubble is one product — market share against review moat; bubble size tracks estimated sales, color grades how beatable the incumbent looks.
All 17 tracked products in this niche — three views at once, no toggling.
Top sellers
by 90-day click share
Performance Tool W80671 37 Degree Flaring Tool For AN and JIC Fittings Silver
Performance Tool$22.383.4★319 rev

RIDGID 41162 377 Precision Non-Ratcheting Pipe Flaring Tool Flaring Tool for 37-degree SAE Flares
RIDGID$151.424.5★261 rev
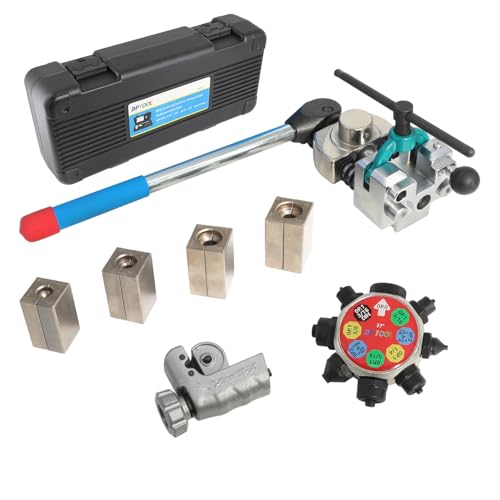
DPTOOL Brake Line Flaring Tool Kit 37 Degree Single Double and Bubble Flares Brake Line and Tubing Flaring Tool for 3/16 1/4 5/16 3/8 and 4.75mm Tubing Brake Flare Tool for Steel Metal Tube
DPTOOL$73.494.5★178 rev
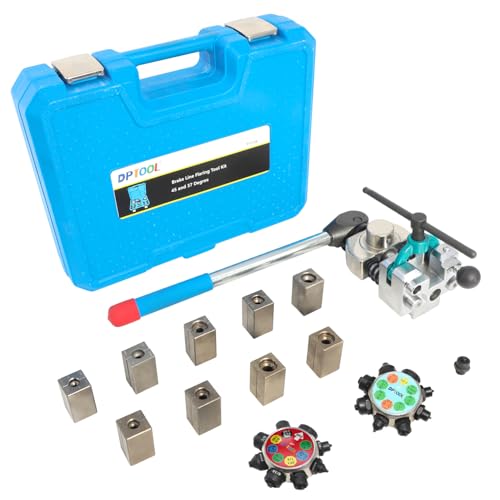
DPTOOL Brake Line Flaring Tool Kit 45 and 37 Degree Single Double and Bubble Flares Brake Line and Tubing Flaring Tool for 3/16 1/4 5/16 3/8 and 4.75mm Tubing
DPTOOL$126.344.5★178 rev
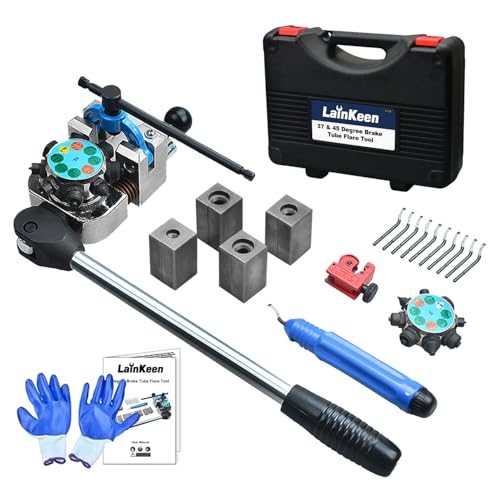
LainKeen Brake Line Flaring Tool Kit for 45 and 37 Degree Single Double and Bubble Flares Brake Line and Tubing Flaring Tool for 3/16 1/4 5/16 3/8 Tubes
LainKeen$114.114.5★102 rev
Newest
by launch dateDPTOOL Brake Line Flaring Tool Kit 37 Degree Single Double and Bubble Flares Brake Line and Tubing Flaring Tool for 3/16 1/4 5/16 3/8 and 4.75mm Tubing Brake Flare Tool for Steel Metal Tube
DPTOOL$73.49178 rev
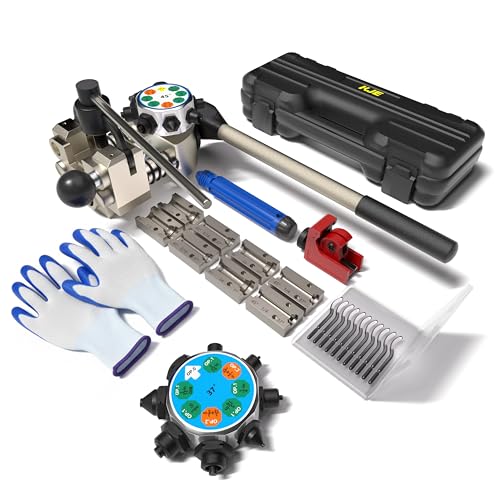
KJE 45 & 37 Degree Brake Line Flaring Tool Kit Single Bubble Double Brake Flare Tool Kit Profession Brake Line and Tubing Flaring Tool for 3/16 1/4 5/16 3/8 Tubes
KJE$106.1027 rev
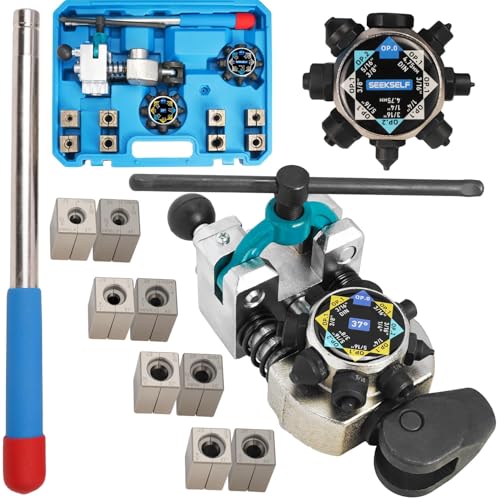
SEEKSELF Professional Brake Line Flaring Tool Kit for 45 & 37 Degree Single Double and Bubble Flares 3/16 1/4 5/16 3/8 and 4.75mm Steel Copper Metal Tubing
SEEKSELF$129.4839 rev
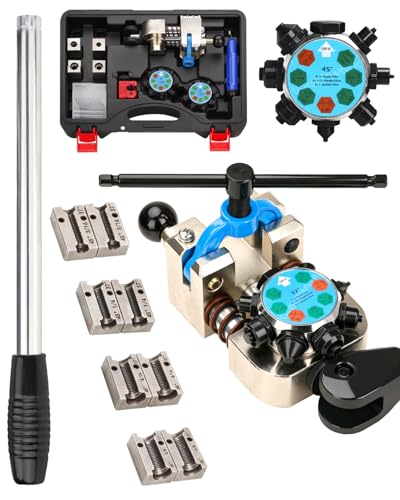
easchwork Professional Brake Line Flaring Tool Kit 45 & 37 Degree Single Bubble Double Flare Compatible 3/16 1/4 5/16 3/8 Tubes
easchwork$115.0411 rev
DPTOOL Brake Line Flaring Tool Kit 45 and 37 Degree Single Double and Bubble Flares Brake Line and Tubing Flaring Tool for 3/16 1/4 5/16 3/8 and 4.75mm Tubing
DPTOOL$126.34178 rev
Trending
90-day click momentumDPTOOL Brake Line Flaring Tool Kit 37 Degree Single Double and Bubble Flares Brake Line and Tubing Flaring Tool for 3/16 1/4 5/16 3/8 and 4.75mm Tubing Brake Flare Tool for Steel Metal Tube
DPTOOL$73.494.5★
DPTOOL Brake Line Flaring Tool Kit 45 and 37 Degree Single Double and Bubble Flares Brake Line and Tubing Flaring Tool for 3/16 1/4 5/16 3/8 and 4.75mm Tubing
DPTOOL$126.344.5★
KJE 45 & 37 Degree Brake Line Flaring Tool Kit Single Bubble Double Brake Flare Tool Kit Profession Brake Line and Tubing Flaring Tool for 3/16 1/4 5/16 3/8 Tubes
KJE$106.104.4★
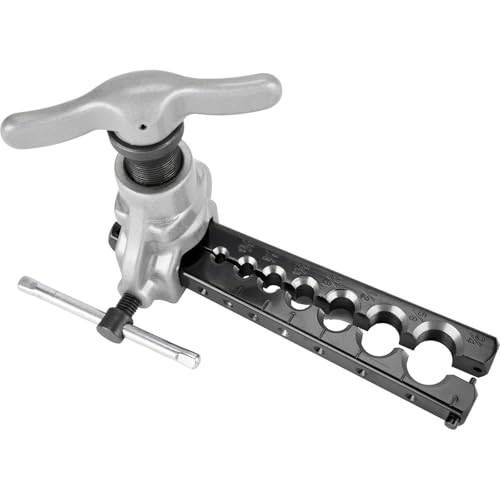
Deluxe 37 Degree Mild and Stainless Brake Line and Fuel Line Flaring Tool for AN and JIC Fittings Creates Precise Single Flares on Multiple Tubing Sizes and Materials
Speedway Motors$117.105.0★
Performance Tool W80671 37 Degree Flaring Tool For AN and JIC Fittings Silver
Performance Tool$22.383.4★
Demand & seasonality
Weekly Amazon search volume, last 104 weeks — -8.5% search growth over the last 90 days.No pronounced peak months · busiest ÷ quietest = 1.3×
Reviews
What buyers praise and complain about, mined from review topics.What buyers love
“Decent DIY Quality”
“Worth the investment”
“Works well,”
“Easy to Use”
“As advertised”
“I went and got a better one from a local auto parts store and had zero issues making the parts I needed”
“Works great for AN fittings”
“I like the little carry case to keeps it together instead of getting scattered around garage”
“Very easy to set up and use”
“Worked fine to make fuel”
What buyers complain about
“Junk”
“The cherry on top is the line cutter came with rust on it”
“Instructions are poorly spelled out”
“Product doesnt work”
“But right now it's a waste of time and money”
“I just wasted an hour of my life trying to make one decent flare with this tool”
“Its main issue is poorly machined flare and vice surfaces,”
“wont fit in tight areas”
“What you have here is a very imprecise tool that you need to work on a precision part”
“wobble on the first use”