18x8.5-10 tractor tires
Worth a lookShows low returns (0.4%), but prices mostly outside the sweet spot ($57.56–$379.05) keeps it on the watch list.
Returns
Incredible0.4%return rate — above 6% kills the launch gate
Review moat
Great360.83avg incumbent reviews — the moat a new listing must climb
Avg price
Good$130.74avg listing price — sweet spot $15–$100
Competition
Good48%top-5 click share — leaders hold, buyers still browse
Conversion
Good4.4%search→purchase rate — share of searches ending in a sale
Brand share
Good74%top-5 brand share — brands hold most of the demand
Market size
Okay$271K$271K/yr · 47K searches
Growth
Okay+19.1%90-day search growth — must beat 0% to launch
Quality gap
Bad4.6★avg incumbent rating — lower means beatable quality
Price range
Bad$57.56–$379.05cheapest to priciest tracked listing — scored on the share inside $15–$100
Competition
The top 5 products take 48% of clicks — established leaders, but buyers still shop beyond them.Brands
14 rising
Sellers
36
Top-5 brand share
74%
Open market
20%
- HORSESHOE34%
- Veteran Tire and Rubber17%
- Carlisle8%
- MowerPartsGroup8%
- MOTOOS7%
- AR-PRO6%
Product shelf
Each bubble is one product — market share against review moat; bubble size tracks estimated sales, color grades how beatable the incumbent looks.
All 30 tracked products in this niche — three views at once, no toggling.
Top sellers
by 90-day click share
Veteran Tire and Rubber Garden Master Tractor Tire (18x8.50-10 OE)
Veteran Tire and Rubber$84.044.7★450 rev
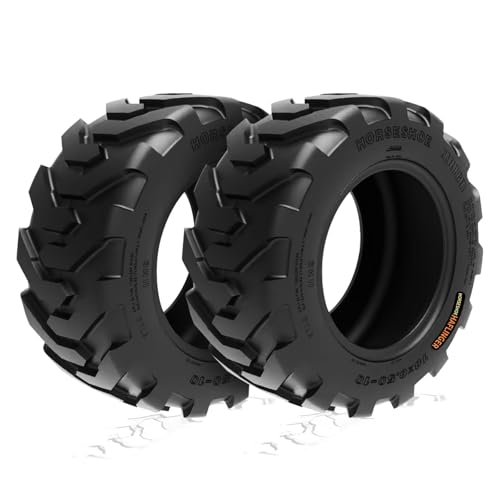
2 NEW HORSESHOE 18x8.50-10 8Ply Skid Tractor Trac Lug Tubeless Tires w/Rim-Guard Wall Heavy Duty D Load 18x8.50x10 18x8.5-10 NHS R-4 G2/L2 T168 18x8.5x10 1885010
HORSESHOE$171.694.8★247 rev
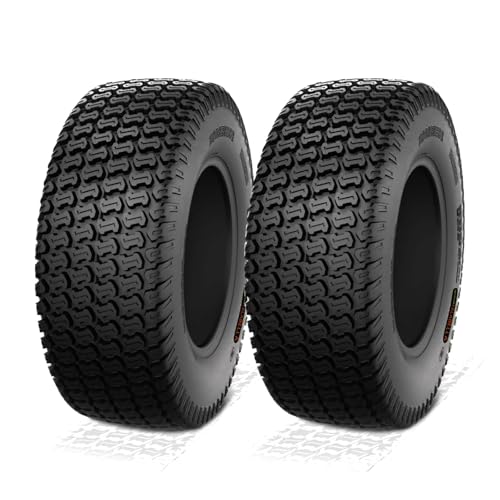
HORSESHOE FALABELLA 2 New 18x8.50-10 / 18x8.5-10 6PR TURF-KING LAWN MOWER TIRES LRC Heavy Duty Color-Sidewall (18x8.50-10 6Ply)
HORSESHOE$105.564.8★167 rev
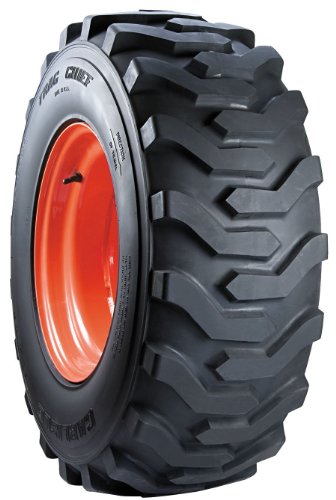
Carlisle Trac Chief Lawn & Garden Tire - 18X8.50-10
Carlisle$92.674.7★697 rev
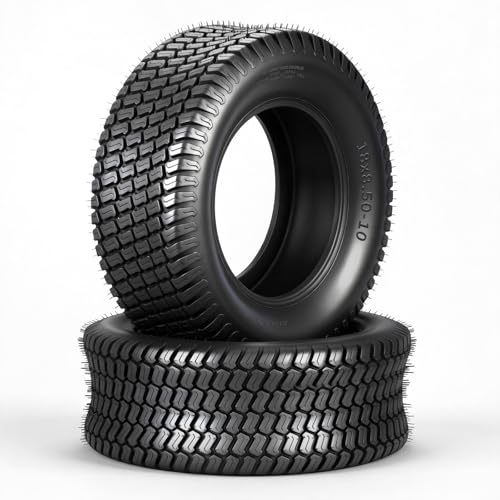
MOTOOS 18x8.50-10 Lawn Mower Turf Tires (Set of 2) 4 Ply Turf S Pattern 18x8.5x10 Tubeless Tires for Lawn & Garden Riding Mower Tractor Golf Cart Utility Vehicles
MOTOOS$64.404.4★523 rev
Newest
by launch date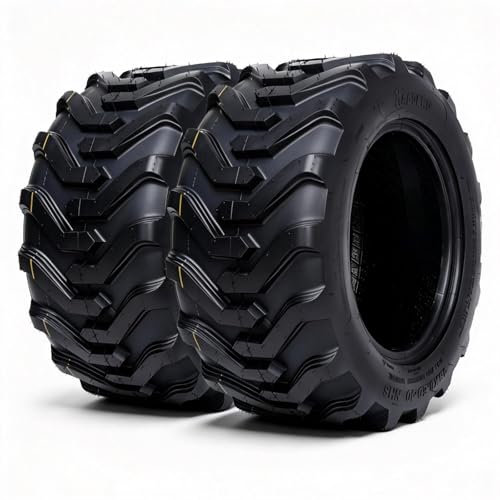
18x8.50-10 Skid Steer Tractor Tire Heavy Duty High Traction Chevron Tread Puncture Resistant Reinforced Load Capacity Self-Cleaning Tubeless Set of 2
HALBERD$153.170 rev
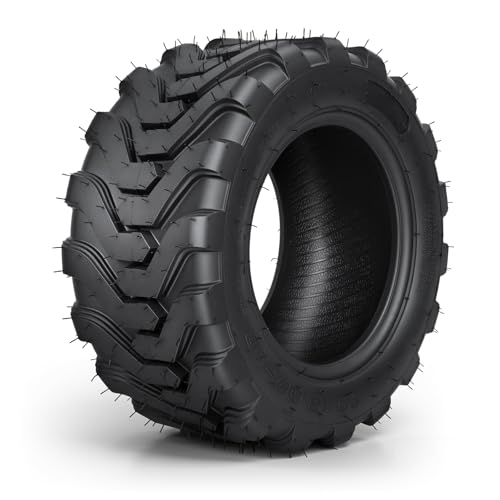
TRIPOWER 18x8.50-10 Garden Master Tractor Tires 6 PR Tubeless 1270 lbs Capacity R4 Heavy Duty Farm and Lawn Master Tractor Tire Compatible with Kubota John Deere 1 Pack
TRIPOWER$82.1625 rev
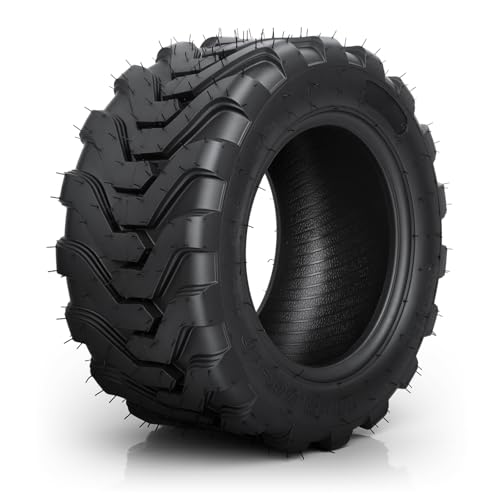
PROPARTS 18x8.50-10 Lawn Mower Tires 18x8.50x10 Agriculture Farm Tractor Turf Tires for Garden Tractor & Riding Lawn Mowers Tubeless 6PR
PROPARTS$57.568 rev
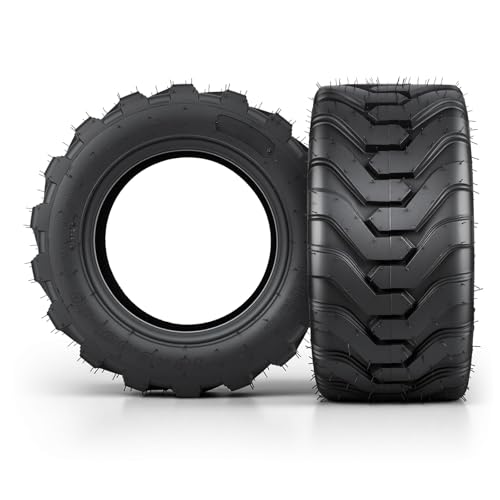
PROPARTS 18x8.50-10 Lawn Mower Tires 18x8.5-10 Agriculture Farm Tractor Turf Tires for Garden Tractor & Riding Lawn Mowers Tubeless Set of 2 6PR
PROPARTS$118.558 rev
MOTOOS 18x8.50-10 Lawn Mower Turf Tires (Set of 2) 4 Ply Turf S Pattern 18x8.5x10 Tubeless Tires for Lawn & Garden Riding Mower Tractor Golf Cart Utility Vehicles
MOTOOS$64.40523 rev
Trending
90-day click momentum18x8.50-10 Skid Steer Tractor Tire Heavy Duty High Traction Chevron Tread Puncture Resistant Reinforced Load Capacity Self-Cleaning Tubeless Set of 2
HALBERD$153.170.0★
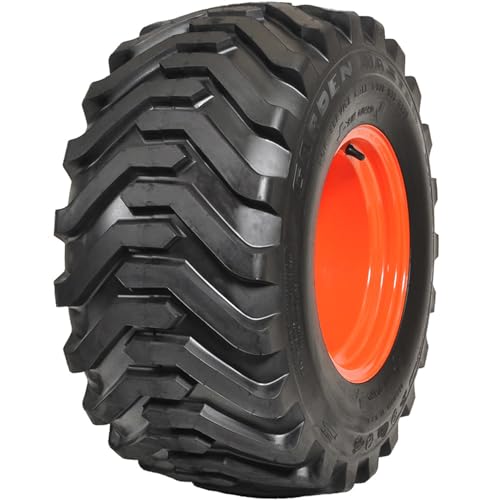
OTR Garden Master Lawn Mower & Garden Tractor All-Season Tire-18X8.50-10 18X8.50X10 72A3 Load Range 4-Ply BSW Black Side Wall
OTR$80.570.0★
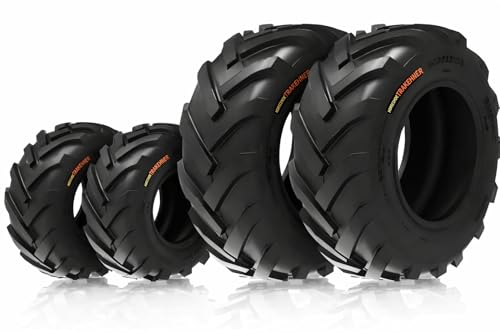
HORSESHOE 4 Super Lug 2 Front 18x8.50-10 6Ply Plus 2 Rear 26X12.00-12 10Ply | Mower Riding Ditch Witch Trencher AG Farm Tractor Tubeless Tires | 18X8.5-10 & 26X12-12
HORSESHOE$379.055.0★
PROPARTS 18x8.50-10 Lawn Mower Tires 18x8.5-10 Agriculture Farm Tractor Turf Tires for Garden Tractor & Riding Lawn Mowers Tubeless Set of 2 6PR
PROPARTS$118.554.8★
PROPARTS 18x8.50-10 Lawn Mower Tires 18x8.50x10 Agriculture Farm Tractor Turf Tires for Garden Tractor & Riding Lawn Mowers Tubeless 6PR
PROPARTS$57.564.8★
Demand & seasonality
Weekly Amazon search volume, last 102 weeks — +19.1% search growth over the last 90 days.Peak months: Apr, May, Jun · busiest ÷ quietest = 2.6×
Reviews
What buyers praise and complain about, mined from review topics.What buyers love
“The tires quality seems to be good”
“Great value”
“Perfect fit”
“Good tires for the money”
“durable”
“As advertised”
“They are good quality have good traction”
“The super lug design really grips well”
“Good tread and traction”
“Installation was straightforward”
What buyers complain about
“Absolute junk”
“DOES NOT FIT PROPERLY”
“Just blew out a 4th tire within a month in a half”
“Mis leading”
“they are thicker. 6ply”
“Heavier than the ones furnished by John Deere”
“Stiff tires make it a little hard to install”
“the side wall is not as robust”