kids pointed scissors
Skip it40/100a small market ($26K/yr) — kids pointed scissors doesn't clear our bar today.
Market/yr
$26K
Growth (1y)
+68.4%
Products
27
Brands
6
was 7 a year ago
Sellers
97
Price range
$2.20–$17.24
Returns
0.4%
Rating
4.7★
Skip it
Scored 40/100 across market size, growth, competition, quality gap, and returns.
Demand
Weekly Amazon search volume, last 102 weeks — +68.4% year over year.Seasonality
Monthly demand index across the year — 1.00 is average.Peak months: Jul, Aug · busiest ÷ quietest = 27.9×
Competition
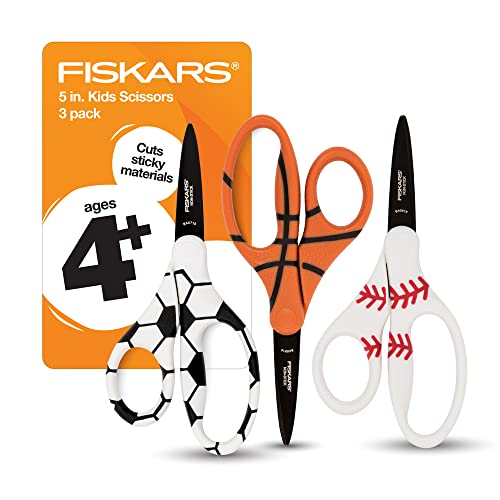
- Fiskars71%
- Scotch18%
- Asdirne5%
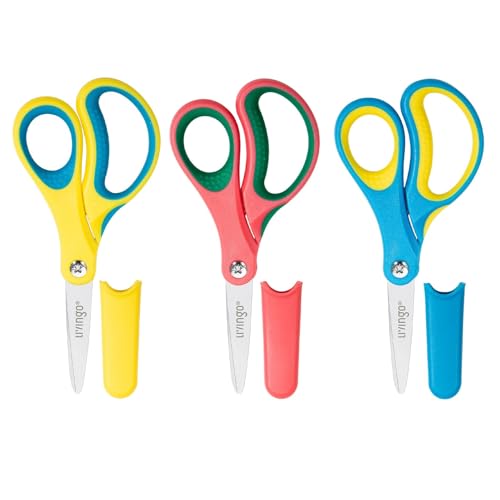
- LIVINGO4%
- Westcott2%
- Amazon Basics1%
- Other0%
The top 5 products take 52% of clicks — established leaders, but buyers still shop beyond them. 6 brands and 97 sellers compete here.
Brands
6 falling
was 7 a year ago
Sellers
97
Top 5 brand share
99%



Product shelf
All 27 tracked products in this niche.
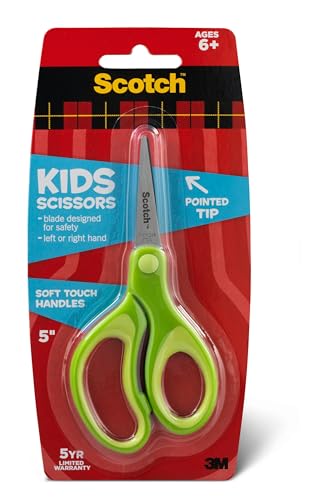
Scotch Kids Pointed Tip Scissors with Soft Touch 5 Inches (1442P) (Colors may vary)
Scotch
$4.044.8★1,639 reviews

Fiskars 5 SoftGrip Pointed-Tip Glitter Scissors for Kids Ages 4-7 Scissors for School or Crafting Back to School Supplies Pink
Fiskars
$4.684.7★1,009 reviews

Fiskars 5 Pointed-Tip Scissors for Kids 4-7 (3-Pack) - Scissors for School or Crafting - Back to School Supplies - Red Blue Turquoise
Fiskars
$9.344.8★2,262 reviews

Fiskars 5 Pointed-Tip Scissors for Kids Ages 4-7 Scissors for School or Crafting Back to School Supplies Red
Fiskars
$6.284.7★773 reviews

Fiskars Blunt-Tip Scissors for Kids School or Crafting 5 Premium Pink 1-Pack
Fiskars
$4.384.8★2,202 reviews
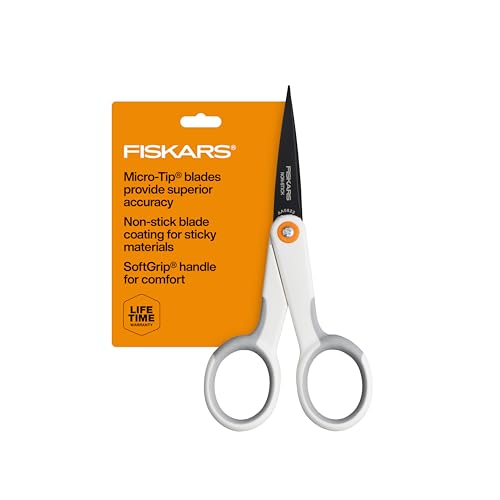
Fiskars Micro Trip Scissors SoftGrip Precision Cutting Shears Non-Stick Stainless Steel Blades 5 inches
Fiskars
$10.004.7★179 reviews

Fiskars Premier No. 5 Micro-Tip Orange-Handled Fabric Scissors Double Loop Handle Sewing and Craft Scissors Orange
Fiskars
$13.104.8★4,276 reviews
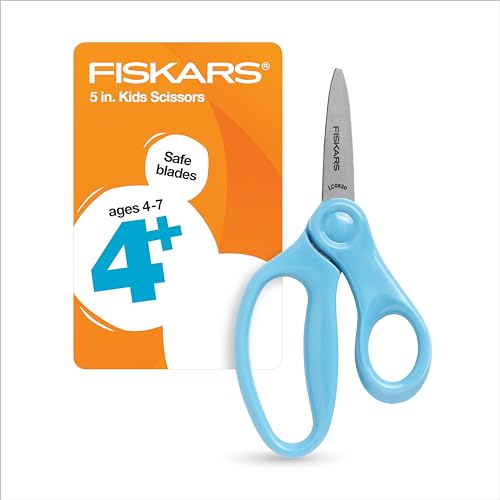
Fiskars 5 Pointed-Tip Scissors for Kids Ages 4-7 Scissors for School or Crafting Back to School Supplies Turquoise
Fiskars
$2.204.8★45 reviews
Reviews
What buyers praise and complain about, mined from review topics.What buyers love
“They stay sharp”
“Decent quality”
“Cuts well”
“GREAT PRICE”
“Nice size”
“Work great”
“Easy to use”
“Comfortable grip”
“Exactly as described”
“comfortable”
What buyers complain about
“Small blades”
“Breaks easily”
“Scissors not sharp”
“Hard to use”
“They are not cheap so worth waiting for one”
“Awkward for my hands”
“Choppy cut”
“Very uncomfortable”
“The non-stick part of the description is not entirely true”
“Cheap, terrible quality, dont hold up”
Top return reasons
- Size-Overall55%
- Sharpness8%
- Advertised Vs Actual Product8%
- Value For Money7%
- Cutting/Trimming4%
- Functionality-Overall2%
- Quality-Overall2%
- Comfort-Overall2%
- Product Condition2%
- Ease Of Use1%