laser beamer
Worth a lookShows a fragmented shelf (top 5 take 25% of clicks), but pricing outside the sweet spot ($509.93 avg) keeps it on the watch list.
Competition
Great25%top-5 click share — an open shelf
Market size
Great€1.1M€1.1M/yr · 287K searches
Review moat
Good511.4avg incumbent reviews — the moat a new listing must climb
Brand share
Good63%top-5 brand share — brands hold most of the demand
Quality gap
Good4.3★avg incumbent rating — lower means beatable quality
Growth
Good+27.5%90-day search growth — must beat 0% to launch
Returns
Bad7.4%return rate — above 6% kills the launch gate
Conversion
Bad0.7%search→purchase rate — share of searches ending in a sale
Price range
Bad€76.43–€2035.45cheapest to priciest tracked listing — scored on the share inside $15–$100
Avg price
Bad€509.93avg listing price — sweet spot $15–$100
Competition
Clicks spread well past the top 5 (25% combined) — an open shelf where new products get seen.Brands
30 rising
Sellers
184
Top-5 brand share
63%
Open market
33%
- Acer22%
- WiMiUS20%
- VOPLLS11%
- Hisense5%
- XGIMI5%
- JmGO4%
Product shelf
Each bubble is one product — market share against review moat; bubble size tracks estimated sales, color grades how beatable the incumbent looks.
All 70 tracked products in this niche — three views at once, no toggling.
Top sellers
by 90-day click share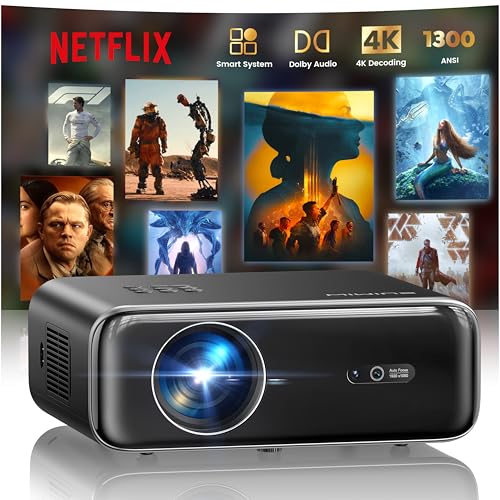
Smart Beamer jetzt mit Netflix Dolby Audio WiMiUS 1300 ANSI Autofokus/6D Trapezkorrektur Led Beamer 4K Heimkino Unterstützt WiFi Bluetooth Full HD 1080P Outdoor Deckenmontage Projektor für Handy
WiMiUS€213.444.6★6,496 rev

Acer X1528Ki DLP Beamer (Full HD (1.920 x 1.080 Pixel) 5.200 ANSI Lumen 10.000:1 Kontrast 3D Keystone 1x 3 Watt Lautsprecher HDMI (HDCP)) weiß Home Cinema/Business
Acer€503.984.2★60 rev

JMGO N1S 4K UHD Mini Beamer Triple Laser Projektor 1100 ISO Lumen Gimbal Echtzeit Autofokus Google TV Netflix 110% BT.2020 HDR10 10W Dolby Audio Blu-ray 3D 200 für Aussen Gaming Business
JmGO€668.744.5★216 rev
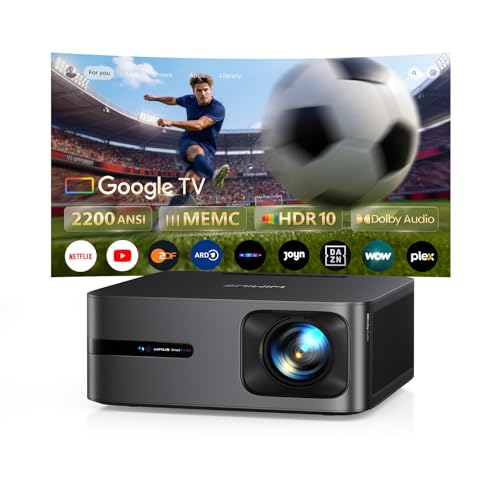
Beamer 4K mit Google TV 14.0 2200 ANSI MEMC HDR10 40W Dolby Audio 4K Beamer Heimkino KI-Bildanpassung Smart Projektor Google Sprachsteuerung 2-Wege Bluetooth 5.4 WiFi6 2+32GB HDMI 2.1
WiMiUS€368.494.7★202 rev
![Beamer 4K [1500 ANSI|Google TV] FHD 1080P Beamer Heimkino 4K Unterstützt Autofokus Auto Trapezkorrektur 30W Smart Tageslicht Projektor Offizielle Lizenz APPs WiFi6 Bluetooth für Home Outdoor](https://m.media-amazon.com/images/I/51RTOp+okzL.jpg)
Beamer 4K [1500 ANSI|Google TV] FHD 1080P Beamer Heimkino 4K Unterstützt Autofokus Auto Trapezkorrektur 30W Smart Tageslicht Projektor Offizielle Lizenz APPs WiFi6 Bluetooth für Home Outdoor
WiMiUS€247.544.3★597 rev
Newest
by launch date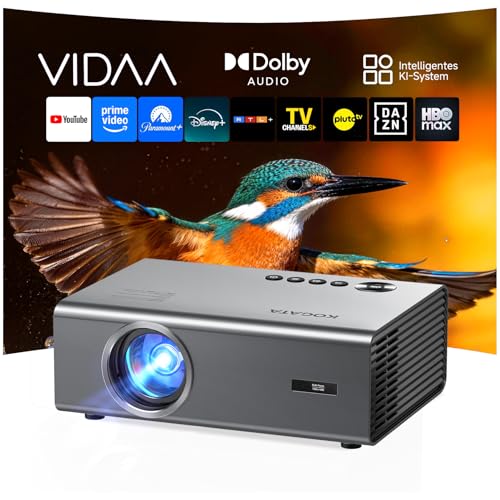
4K Smart Beamer mit VIDAA kompatibel mit Netflix-App Dolby Audio & HDR10+ | KOGATA Original AirPlay Auto-Fokus 6D Keystone WiFi 6 & Bluetooth | Heimkino Projektor für Streaming ohne TV-Stick
KOGATA€227.08879 rev

Yaber K300s Ultra-Kurzdistanz-Beamer: 4K-Unterstützung Triple-Laser DLP Heimkino Projektor 100 Bild aus 23 cm Dolby Vision 150% NTSC Google TV 30W JBL-Lautsprecher Gaming & Home Cinema
Yaber PROJECTOR€737.249 rev
![Beamer-4K [Kompatibel mit Netflix & Offizielle App] 2026 Neuer 1080PHD Mini-Smart Beamer-Heimkino mit eARC CEC Autofokus Projektor WiFi6 Bluetooth Dolby Audio Outdoor Projector](https://m.media-amazon.com/images/I/41uXJ3BqhiL.jpg)
Beamer-4K [Kompatibel mit Netflix & Offizielle App] 2026 Neuer 1080PHD Mini-Smart Beamer-Heimkino mit eARC CEC Autofokus Projektor WiFi6 Bluetooth Dolby Audio Outdoor Projector
Lisowod€214.0775 rev
![Smart Beamer [Kompatibel mit Netflix & 20W Dolby Audio] 1200 ANSI Autofokus & 6D Trapezkorrektur TOPTRO Beamer 4K Heimkino Unterstützt FHD1080P HDR10 WiFi 6/2-Wege-Bluetooth geräuscharmer Projektor](https://m.media-amazon.com/images/I/51aLq8OjAVL.jpg)
Smart Beamer [Kompatibel mit Netflix & 20W Dolby Audio] 1200 ANSI Autofokus & 6D Trapezkorrektur TOPTRO Beamer 4K Heimkino Unterstützt FHD1080P HDR10 WiFi 6/2-Wege-Bluetooth geräuscharmer Projektor
TOPTRO€211.19267 rev
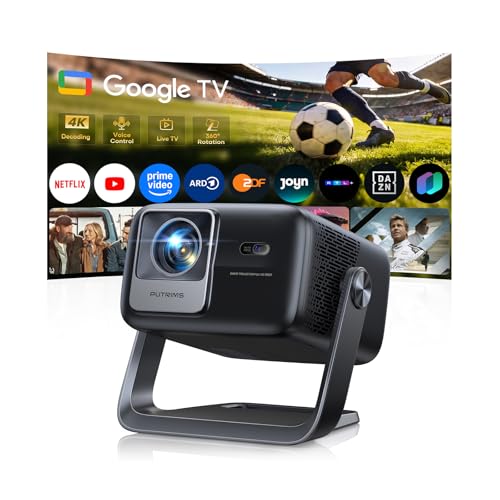
Smart BeamerGoogle TV & 30W LautsprecherBeamer 4K Heimkino Unterstützt Autofokus/6D Trapezkorrektur HDR10 WiFi Bluetooth FULL HD 1080P LED Projector 360 Drehständer Outdoor Projektor 4K für HDMI
PUTRIMS€241.42114 rev
Trending
90-day click momentumSmart BeamerGoogle TV & 30W LautsprecherBeamer 4K Heimkino Unterstützt Autofokus/6D Trapezkorrektur HDR10 WiFi Bluetooth FULL HD 1080P LED Projector 360 Drehständer Outdoor Projektor 4K für HDMI
PUTRIMS€241.425.0★

Mini BeamerAutofokus/Trapezkorrektur Projektor 1080P Full HD 10000L WiFi6 Bluetooth 4K Unterstützt VOPLLS Beamer Klein Heimkino 360 Drehbar Projector für Handy
VOPLLS€76.433.5★
![[30000Lumen & Offiziell lizenzierte App] Smart Beamer 4K Heimkino VISSPL 3D Dolby Audio und Autofokus Outdoor Projektor Handy WiFi6 Bluetooth Video Projektor mit 360 verstellbarem Standfuß(Grau)](https://m.media-amazon.com/images/I/51tOZHCsZcL.jpg)
[30000Lumen & Offiziell lizenzierte App] Smart Beamer 4K Heimkino VISSPL 3D Dolby Audio und Autofokus Outdoor Projektor Handy WiFi6 Bluetooth Video Projektor mit 360 verstellbarem Standfuß(Grau)
VISSPL€176.824.3★
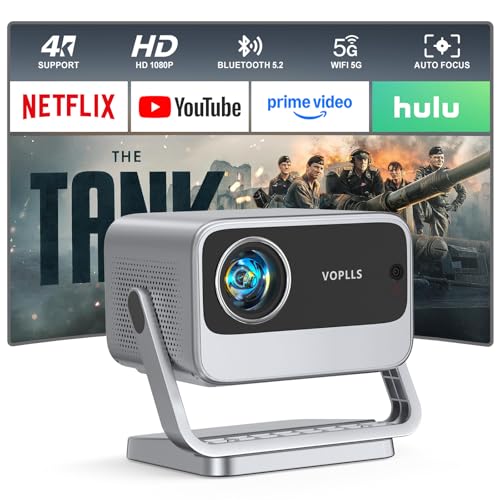
Smart Beamer 4KNetflix vorinstalliert & Dolby Audio VOPLLS 30000L Autofokus & Trapezkorrektur Beamer Heimkino Full HD 1080P WiFi6 Bluetooth Videoprojektor für Handy/PC Outdoor & Fußballabend
VOPLLS€133.873.9★
Beamer 4K mit Google TV 14.0 2200 ANSI MEMC HDR10 40W Dolby Audio 4K Beamer Heimkino KI-Bildanpassung Smart Projektor Google Sprachsteuerung 2-Wege Bluetooth 5.4 WiFi6 2+32GB HDMI 2.1
WiMiUS€368.494.7★
Demand & seasonality
Weekly Amazon search volume, last 85 weeks — +27.5% search growth over the last 90 days.Peak months: Feb, Jun, Oct · busiest ÷ quietest = 2.6×
Reviews
What buyers praise and complain about, mined from review topics.What buyers love
“its honestly impressive for the price”
“Sound is decent with Dolby Audio”
“Top quality”
“- Full HD”
“Installation super easy”
“Kaufempfehlung - super Handhabung”
“Bild ist super”
“The brightness is good enough even with some ambient light”
“Alle gängigen Streaming-Apps (Netflix, Amazon, Disney & Co.”
“Flottes Betriebssystem und stabile Verbindungen”
What buyers complain about
“Diese sind laut”
“Audio flop”
“Nach 2,5 Jahren defekt”
“Ich habe sehr häufige Software Probleme”
“nicht besonders hell”
“Verbindungsprobleme”
“Tageslicht tauglich sehr unzufrieden”
“Autofokus gibt es auch nicht”
“50€ Beamer sind besser”
“Oder generell Schrott”