iphone 15 pro max 512gb
Worth a lookShows searches that convert (20.5% search→purchase), but a deep review moat (94,808 avg reviews) keeps it on the watch list.
Conversion
Incredible20.5%search→purchase rate — share of searches ending in a sale
Market size
Incredible€2.9M€2.9M/yr · 1.5M searches
Returns
Incredible0.9%return rate — above 6% kills the launch gate
Quality gap
Good4.4★avg incumbent rating — lower means beatable quality
Price range
Okay€5.64–€19.80cheapest to priciest tracked listing — scored on the share inside $15–$100
Competition
Okay68%top-5 click share — leaders hold, buyers still browse
Avg price
Okay€9.30avg listing price — sweet spot $15–$100
Growth
Okay+1.0%90-day search growth — must beat 0% to launch
Brand share
Okay89%top-5 brand share — brands hold most of the demand
Review moat
Bad94,808.06avg incumbent reviews — the moat a new listing must climb
Competition
The top 5 products take 68% of clicks — established leaders, but buyers still shop beyond them.Brands
10 falling
Sellers
33
Top-5 brand share
89%
Open market
8%
- NEW'C40%
- JETech23%
- TOCOL10%
- TORRAS10%
- OMOTON7%
- SPARIN3%
- Open — no brand owns it (4 brands, 8%)
Product shelf
Each bubble is one product — market share against review moat; bubble size tracks estimated sales, color grades how beatable the incumbent looks.
All 18 tracked products in this niche — three views at once, no toggling.
Top sellers
by 90-day click share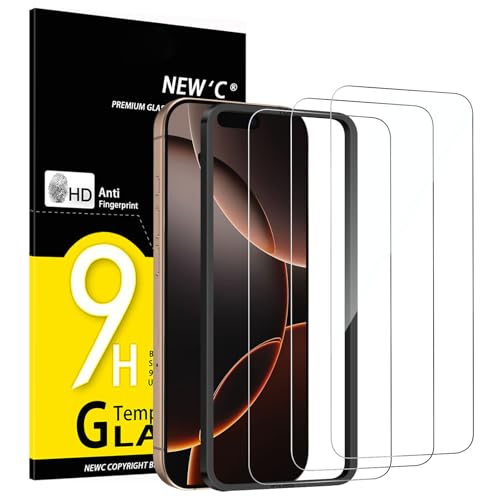
NEWC 3 Stück für iPhone 17 17 Pro iPhone 16 Pro für Panzerglas (6 3 Zoll) Frei von Kratzern 9H Härte HD Displayschutzfolie Ultra-klar Ultrabeständig -Einfaches Installationswerkzeug enthalten
NEW'C€6.464.3★286,374 rev
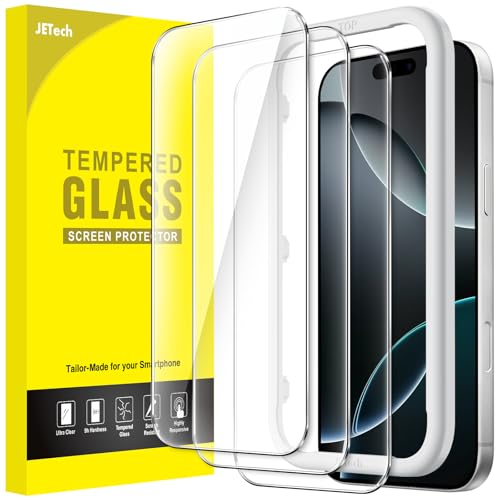
JETech Schutzfolie für iPhone 16 Pro 6 3 Zoll Gehärtete Glas Displayschutz mit Einfachem Installationswerkzeug Hat Keinen Einfluss auf die Hülle HD Klar 3 Stück
JETech€6.704.4★86,819 rev
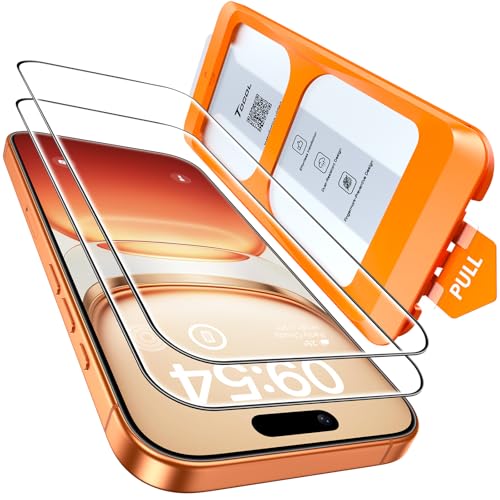
TOCOL für iPhone 16 Pro für Panzerglas 6 3 Zoll Full Screen Automatische Installation 9H Stoßfest Kratzfest Anti-Fingerabdruck Anti-Bläschen Folie für iPhone 16 Pro Kompatibel mit Hülle 2 Stück
TOCOL€8.154.4★49,073 rev
![TORRAS für iPhone 16 Pro für Panzerglas [TOP Stoßfest] Schutzfolie für iPhone 16 Pro Folie 9H+ Schutzglas Absolut Anti-Fingerabdruck [0 Blasen & 0 Staub Montage] Kompatibel mit Hülle 2 Stück](https://m.media-amazon.com/images/I/51SKChAmrRL.jpg)
TORRAS für iPhone 16 Pro für Panzerglas [TOP Stoßfest] Schutzfolie für iPhone 16 Pro Folie 9H+ Schutzglas Absolut Anti-Fingerabdruck [0 Blasen & 0 Staub Montage] Kompatibel mit Hülle 2 Stück
TORRAS€19.804.4★50,651 rev
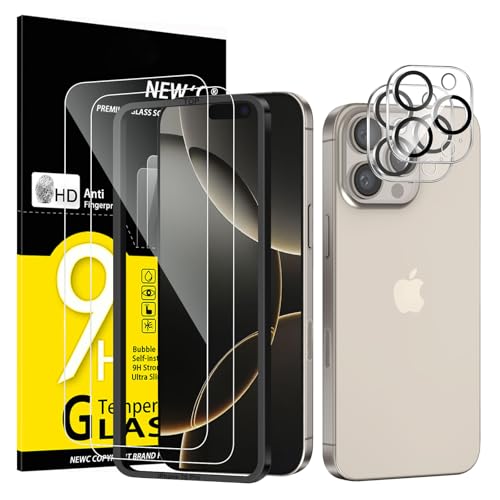
NEWC für iPhone 16 Pro für Panzerglas 6 3 Zoll (2 Stück) und 2 x Kamera Panzer Schutz für Kameraschutz (2 Stück) -Kratzfest -extrem widerstandsfähig -9H-Härteglas
NEW'C€6.734.4★61,092 rev
Newest
by launch date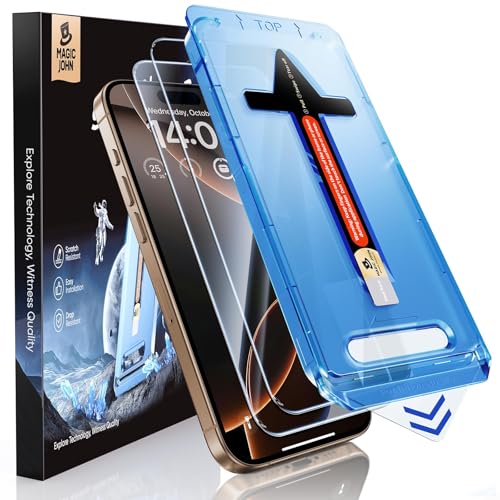
MAGIC JOHN 2 Stück für iPhone 16 Pro für Schutzfolie (6 3 Zoll) Auto-Dust-Eliminierung 9H HD Klar Bläschenfrei Einfache Installation
MAGIC JOHN€15.61141 rev
NEWC 3 Stück für iPhone 17 17 Pro iPhone 16 Pro für Panzerglas (6 3 Zoll) Frei von Kratzern 9H Härte HD Displayschutzfolie Ultra-klar Ultrabeständig -Einfaches Installationswerkzeug enthalten
NEW'C€6.46286,374 rev
![NEWC 3 Stück Full Screen für iPhone 17 17 Pro iPhone 16 Pro Panzerglas (6 3 Zoll) Schutzglas [Auto-Installation] Frei von Kratzern 9H Härte Displayschutzfolie Ultrabeständig folie](https://m.media-amazon.com/images/I/51lLLf8sbPL.jpg)
NEWC 3 Stück Full Screen für iPhone 17 17 Pro iPhone 16 Pro Panzerglas (6 3 Zoll) Schutzglas [Auto-Installation] Frei von Kratzern 9H Härte Displayschutzfolie Ultrabeständig folie
NEW'C€10.26131,731 rev
![OMOTON für iPhone 17/17 Pro und iPhone 16 Pro für Panzerglas [Full Screen] TOP Bruchsicherheit Schutzfolie für iPhone 17/17 Pro/16 Pro mit Montagerahmen 9H Härte Bläschenfrei 3 Stück](https://m.media-amazon.com/images/I/418ueYQBblL.jpg)
OMOTON für iPhone 17/17 Pro und iPhone 16 Pro für Panzerglas [Full Screen] TOP Bruchsicherheit Schutzfolie für iPhone 17/17 Pro/16 Pro mit Montagerahmen 9H Härte Bläschenfrei 3 Stück
OMOTON€5.7948,263 rev

NEWC 3 Stück Sichtschutz für iPhone 17 17 Pro iPhone 16 Pro für Panzerglas (6 3 Zoll) Blickschutzfolie Privacy screen mit Anti Spy-Verbesserter - Einfaches Installationswerkzeug enthalten
NEW'C€7.69286,374 rev
Trending
90-day click momentumNEWC 3 Stück Sichtschutz für iPhone 17 17 Pro iPhone 16 Pro für Panzerglas (6 3 Zoll) Blickschutzfolie Privacy screen mit Anti Spy-Verbesserter - Einfaches Installationswerkzeug enthalten
NEW'C€7.694.3★
![UNBREAKcable Bildschirmschutz für iPhone 16 Pro - 3er Pack Doppelte bruchsichere HD-Gehärtetes Glas [Vollständige Abdeckung] [Einfache Installationsrahmen] [9H-Härte] [Hüllefreundlich] für Apple 6 3](https://m.media-amazon.com/images/I/41TG9Qt9IfL.jpg)
UNBREAKcable Bildschirmschutz für iPhone 16 Pro - 3er Pack Doppelte bruchsichere HD-Gehärtetes Glas [Vollständige Abdeckung] [Einfache Installationsrahmen] [9H-Härte] [Hüllefreundlich] für Apple 6 3
UNBREAKcable€11.244.4★
NEWC 3 Stück für iPhone 17 17 Pro iPhone 16 Pro für Panzerglas (6 3 Zoll) Frei von Kratzern 9H Härte HD Displayschutzfolie Ultra-klar Ultrabeständig -Einfaches Installationswerkzeug enthalten
NEW'C€6.464.3★
MAGIC JOHN 2 Stück für iPhone 16 Pro für Schutzfolie (6 3 Zoll) Auto-Dust-Eliminierung 9H HD Klar Bläschenfrei Einfache Installation
MAGIC JOHN€15.614.2★

JETech Sichtschutz für iPhone 16 Pro 6 3 Zoll mit Kameraschutz Anti-Spy Gehärtete Glas Schutzfolie Einfaches Installationswerkzeug 2 Stück Jeweils
JETech€10.264.4★
Demand & seasonality
Weekly Amazon search volume, last 104 weeks — +1.0% search growth over the last 90 days.Peak months: Oct, Nov, Dec · busiest ÷ quietest = 3.6×
Reviews
What buyers praise and complain about, mined from review topics.What buyers love
“Super Produkt”
“Easy”
“Passt”
“Bester Schutz für mein Handy”
“Superleichte Installation”
“Super Preis/Leistung”
“Nachdem so viel positive Werbung hier gemacht wurde, waren meine Erwartungen recht hoch”
“Solide”
“Fazit: Ultrabeständig, kratzfrei, einfache Montage und top Preis-Leistungs-Verhältnis”
“volle Touch-Funktion”
What buyers complain about
“Qualität Flop”
“Einmal heruntergefallen, sofort defekt...”
“Passt nicht 100 %”
“Preis leistung null”
“Hält am Display überhaupt nicht”
“Einfach schlecht - noch keine 24 h installiert”
“Unbrauchbar”
“Extrem empfindlich”
“Löst sich am Rand”
“Beschreibung nicht richtig”