amazon fernseher
Skip itPrices mostly outside the sweet spot ($100.38–$471.81) — this niche doesn't clear our bar today.
Quality gap
Great4.1★avg incumbent rating — lower means beatable quality
Review moat
Okay1,509.39avg incumbent reviews — the moat a new listing must climb
Returns
Okay3.1%return rate — above 6% kills the launch gate
Competition
Okay59%top-5 click share — leaders hold, buyers still browse
Avg price
Okay€223.90avg listing price — sweet spot $15–$100
Brand share
Okay87%top-5 brand share — brands hold most of the demand
Growth
Bad-18.8%90-day search growth — must beat 0% to launch
Market size
Bad€36K€36K/yr · 85K searches
Conversion
Bad0.2%search→purchase rate — share of searches ending in a sale
Price range
Bad€100.38–€471.81cheapest to priciest tracked listing — scored on the share inside $15–$100
Competition
The top 5 products take 59% of clicks — established leaders, but buyers still shop beyond them.Brands
10 falling
Sellers
60
Top-5 brand share
87%
Open market
13%
- Hisense42%
- Samsung16%
- PHILIPS10%
- TCL7%
- DYON6%
- OFD6%
- Open — no brand owns it (4 brands, 13%)
Product shelf
Each bubble is one product — market share against review moat; bubble size tracks estimated sales, color grades how beatable the incumbent looks.
All 18 tracked products in this niche — three views at once, no toggling.
Top sellers
by 90-day click share![Hisense 43E6NT 108cm (43 Zoll) Fernseher 4K UHD Smart TV Precision Colour HDR Dolby Vision 60Hz Triple Tuner DVB-C/S/S2/T/T2 WiFi HDMI 2.1 Bluetooth Alexa Built-in Schwarz [2024]](https://m.media-amazon.com/images/I/41ZW6FdOBSL.jpg)
Hisense 43E6NT 108cm (43 Zoll) Fernseher 4K UHD Smart TV Precision Colour HDR Dolby Vision 60Hz Triple Tuner DVB-C/S/S2/T/T2 WiFi HDMI 2.1 Bluetooth Alexa Built-in Schwarz [2024]
Hisense€189.964.4★4,375 rev

Philips 32PHS6000 HD LED Smart TV - 32 Zoll Display mit Pixel Plus Titan OS Plattform Und Dolby Digital Sound - Funktioniert Mit Alexa Und Google Sprachassistent 2025
PHILIPS€113.174.1★689 rev
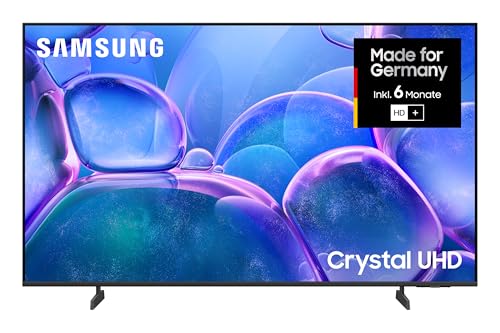
Samsung Crystal UHD 4K U7099F 43 Zoll (108 cm) LED Fernseher Optimiert für Fussball und Gaming Crystal Prozessor 4K AI Upscaling SmartThings Knox Security Kostenlose Inhalte Smart AI TV
Samsung€222.774.3★1,055 rev
![Hisense 55E7DS Fernseher 55 Zoll 4K UHD QLED Smart TV Hi-View AI Engine 60Hz Game Mode Plus Dolby Vision IQ HI-QLED Colour Filmmaker Mode AI Smooth Motion Airplay Sprachsteuerung[2026]](https://m.media-amazon.com/images/I/41tb0pZcCYL.jpg)
Hisense 55E7DS Fernseher 55 Zoll 4K UHD QLED Smart TV Hi-View AI Engine 60Hz Game Mode Plus Dolby Vision IQ HI-QLED Colour Filmmaker Mode AI Smooth Motion Airplay Sprachsteuerung[2026]
Hisense€249.784.5★84 rev
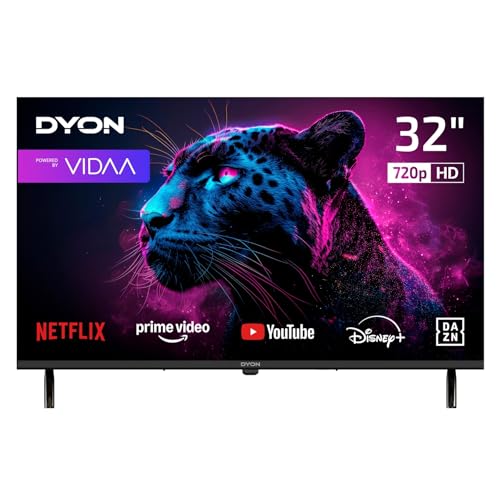
DYON Movie Smart 32 VX - 32 Zoll 80 cm Smart TV mit HD Triple Tuner (DVB-C/-S2/-T2) App Store Prime Video Netflix YouTube DAZN Disney+ waipu.tv Hotelmodus
DYON€111.424.3★3,626 rev
Newest
by launch date![Hisense 32E4DS Fernseher 32 Zoll 4K FHD Smart TV Hi-View AI Engine 60Hz Game Mode Natural Colour Enhancer Dolby Audio DTS Virtual: X Rauschunterdrückung Airplay [2026]](https://m.media-amazon.com/images/I/41H-RWxOjcL.jpg)
Hisense 32E4DS Fernseher 32 Zoll 4K FHD Smart TV Hi-View AI Engine 60Hz Game Mode Natural Colour Enhancer Dolby Audio DTS Virtual: X Rauschunterdrückung Airplay [2026]
Hisense€121.1858 rev
Hisense 55E7DS Fernseher 55 Zoll 4K UHD QLED Smart TV Hi-View AI Engine 60Hz Game Mode Plus Dolby Vision IQ HI-QLED Colour Filmmaker Mode AI Smooth Motion Airplay Sprachsteuerung[2026]
Hisense€249.7884 rev
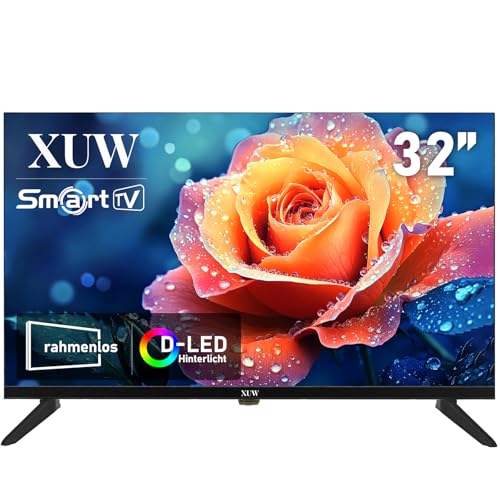
XUW 32 Zoll HD Smart TV D-LED Hintergrundbeleuchtung Fernseher randloses Design HDMI USB DVB-T2/S2 RJ45 Schnittstelle großer Bildschirm für Wohnzimmer Schlafzimmer Heimunterhaltung - schwarz
XUW€100.3812 rev
![Hisense 58E7Q Fehrnseher 58 Zoll QLED&DLED Smart TV Game Mode Plus Filmaker Mode Dolby Vision Atmos HDR10 HLG 4K HDR Immersive AI 4K Upscaler Dolby MS12 DTS X Sprachsteuerung [2025]](https://m.media-amazon.com/images/I/415jrRe3RjL.jpg)
Hisense 58E7Q Fehrnseher 58 Zoll QLED&DLED Smart TV Game Mode Plus Filmaker Mode Dolby Vision Atmos HDR10 HLG 4K HDR Immersive AI 4K Upscaler Dolby MS12 DTS X Sprachsteuerung [2025]
Hisense€319.631,360 rev
Hisense 43E7Q Fehrnseher 43 Zoll 4K UHD QLED Smart TV Game Mode Plus Filmaker Mode Dolby Vision Atmos HDR10 HLG HDR Immersive AI 4K Upscaler Dolby MS12 DTS X Sprachsteuerung [2025]
Hisense€219.261,360 rev
Trending
90-day click momentum
Smart Tech TV LED FHD 40 (101 cm) 40FN01V3 Nonsmart 3xHDMI 2xUSB Hotel Mode Store Mode
Smart Tech€108.983.8★
Hisense 55E7DS Fernseher 55 Zoll 4K UHD QLED Smart TV Hi-View AI Engine 60Hz Game Mode Plus Dolby Vision IQ HI-QLED Colour Filmmaker Mode AI Smooth Motion Airplay Sprachsteuerung[2026]
Hisense€249.784.5★
Hisense 32E4DS Fernseher 32 Zoll 4K FHD Smart TV Hi-View AI Engine 60Hz Game Mode Natural Colour Enhancer Dolby Audio DTS Virtual: X Rauschunterdrückung Airplay [2026]
Hisense€121.184.1★

FPD 40 Zoll (102 cm) Fernseher Full HD Smart TV mit Google TV Google Play integriert HDR 10 Dolby Audio Sprachfernbedienung 1080p Flat Screen Television (CG40-P1)
FPD€160.594.2★
XUW 32 Zoll HD Smart TV D-LED Hintergrundbeleuchtung Fernseher randloses Design HDMI USB DVB-T2/S2 RJ45 Schnittstelle großer Bildschirm für Wohnzimmer Schlafzimmer Heimunterhaltung - schwarz
XUW€100.383.2★
Demand & seasonality
Weekly Amazon search volume, last 88 weeks — -18.8% search growth over the last 90 days.Peak months: Oct, Nov, Dec · busiest ÷ quietest = 3.7×
Reviews
What buyers praise and complain about, mined from review topics.What buyers love
“Beste TV-Investition”
“Das Bild ist brilliant”
“Super Qualität”
“Hätte nie gedacht wie gut der Sound”
“easy to set up”
“TOP Bild”
“Produkt wie beschrieben”
“Super Gerät und leicht zu bedienen”
“viele Apps”
“Farben wirken dank QLED-Technologie kräftig und kontrastreich, 4K-Inhalte sehen scharf aus und auch HDR10+ sowie Dolby Vision machen sich bei passenden Inhalten bemerkbar”
What buyers complain about
“Sound unterirdisch”
“Defekt nach 1 Monat”
“Müll”
“Apps hängen nicht”
“Keine Funktion”
“Sehr unübersichtlich und langsam”
“Manchmal Verbindungsprobleme”
“Reklamation”
“rechte Seite fehlen 30cm Bild”
“Leider zurück, da kaputt. War defekt”