dexcom g6
Worth a lookShows beatable incumbent ratings (3.8★), but weak search conversion (1.3%) keeps it on the watch list.
Quality gap
Incredible3.8★avg incumbent rating — lower means beatable quality
Avg price
Great€87.97avg listing price — sweet spot $15–$100
Returns
Good2.2%return rate — above 6% kills the launch gate
Review moat
Good1,298.07avg incumbent reviews — the moat a new listing must climb
Competition
Good53%top-5 click share — leaders hold, buyers still browse
Market size
Good€331K€331K/yr · 283K searches
Price range
Okay€12.16–€274.17cheapest to priciest tracked listing — scored on the share inside $15–$100
Growth
Okay+5.2%90-day search growth — must beat 0% to launch
Brand share
Okay87%top-5 brand share — brands hold most of the demand
Conversion
Bad1.3%search→purchase rate — share of searches ending in a sale
Competition
The top 5 products take 53% of clicks — established leaders, but buyers still shop beyond them.Brands
15 rising
Sellers
34
Top-5 brand share
87%
Open market
11%
- FreeStyle32%
- Becopa25%
- FORA20%
- Kaio-Dia6%
- Generisch3%
- ULTRAHUMAN3%
- Open — no brand owns it (9 brands, 11%)
Product shelf
Each bubble is one product — market share against review moat; bubble size tracks estimated sales, color grades how beatable the incumbent looks.
All 27 tracked products in this niche — three views at once, no toggling.
Top sellers
by 90-day click share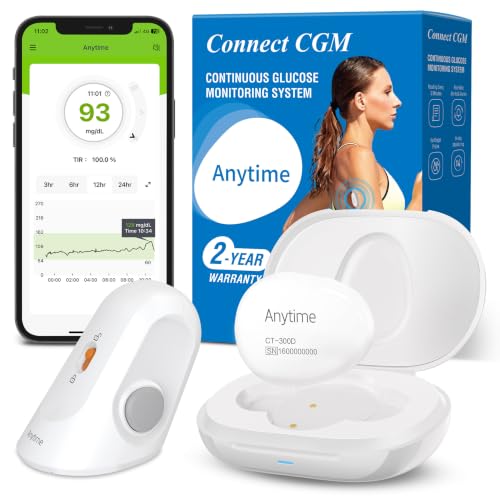
Connect Glukose-Monitoring Transmitter & 1x Sensor | 14 Tage Blutzuckermessgerät ohne Stechen Sensor | Intelligente Warnungen Komfortabel Datenteilung
FORA€54.323.9★19 rev
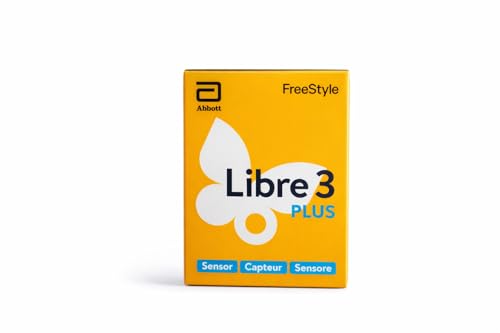
Freestyle Libre 3 Plus Sensor Echtzeit-Glukosemessung kontinuierliches Glukosemonitoring (CGM) diskret & bequem 15 Tage Tragedauer
FreeStyle€99.283.9★40 rev
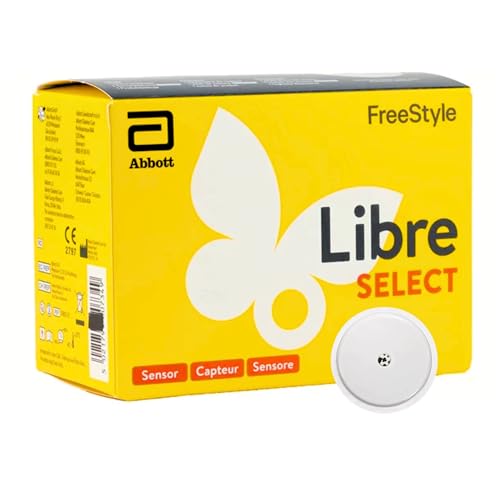
FreeStyle Libre Select Sensor Neues Glukosemesssystem für kontinuierliche Überwachung 15 Tage
FreeStyle€70.472.0★32 rev
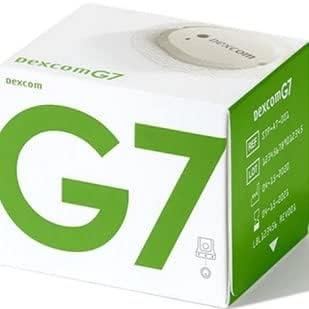
Dexcom G7 Sensor 3 Stück Blutzucker Diabetes G 7 Applikator + Becopa Gutschein 3 pieces
Becopa€241.063.8★18 rev
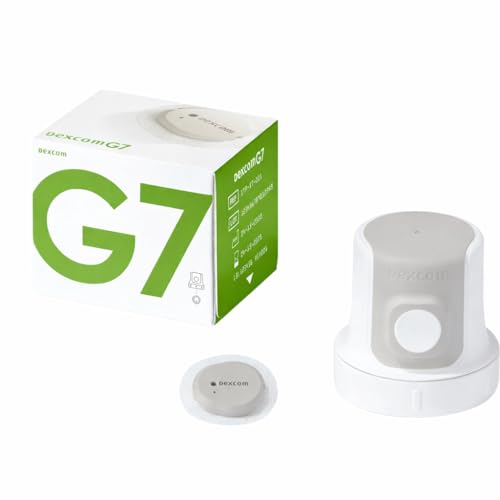
Dexcom G7 Sensor 1 St Blutzucker Diabetes G 7 Applikator Blood Sugar 1 pieces
Becopa€78.424.6★3 rev
Newest
by launch date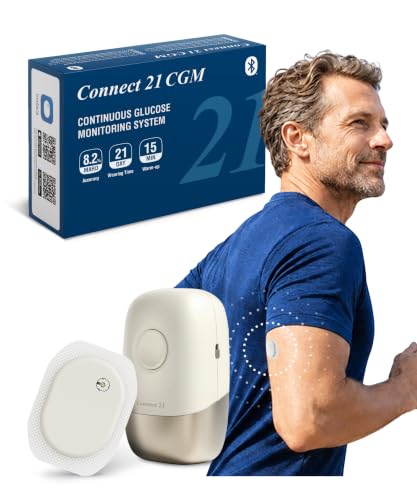
Connect 21 CGM Sensor Blutzuckermessgerät ohne Stechen | 21 Tage | 8 2% MARD | IP58 wasserbeständig | Bluetooth App | CE 2797 | 1 Sensor mit Applikator
Generisch€66.811 rev
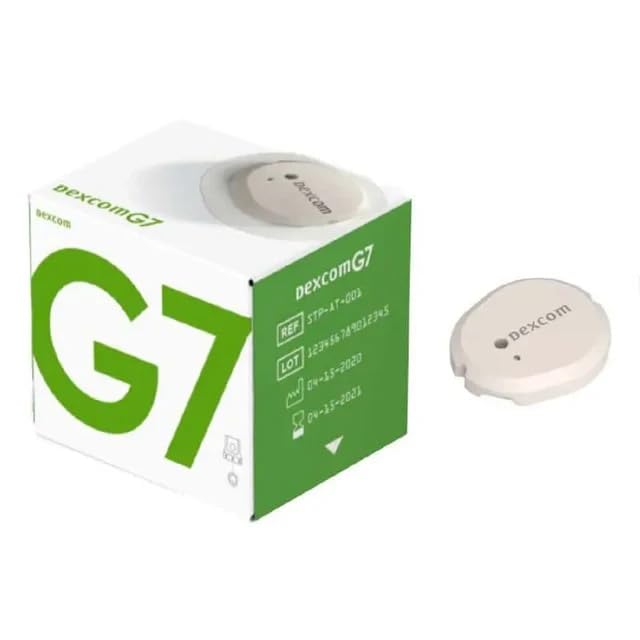
G7 dexcom Sensor 1 St Blutzucker Diabetes G 7 Applikator 1 pieces
Becopa€72.441 rev
Dexcom G7 Sensor 1 St Blutzucker Diabetes G 7 Applikator Blood Sugar 1 pieces
Becopa€78.423 rev
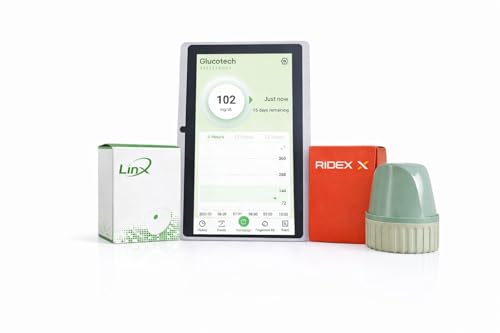
Blutzuckersensor inklusive Lesegerät Kontinuierlicher Glukosesensor CGM zur Gewebezucker- und Blutzuckermessung Einfach anzuwenden Diskret & zuverlässig Medizinprodukt
Generisch€89.310 rev
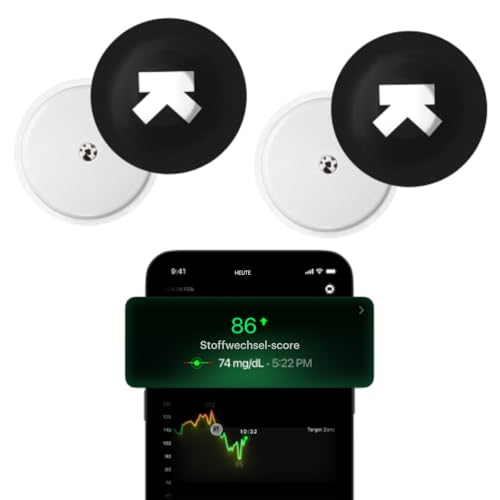
Ultrahuman M1 | Intelligente Glukosemessung per App | Verbessern Lebensstil optimieren Ernährung | 24/7-Glukosemessung mit fortschrittlichen Freestyle Libre 2 Plus CGM-Sensoren (2 Sensors)
ULTRAHUMAN€144.1295 rev
Trending
90-day click momentumConnect 21 CGM Sensor Blutzuckermessgerät ohne Stechen | 21 Tage | 8 2% MARD | IP58 wasserbeständig | Bluetooth App | CE 2797 | 1 Sensor mit Applikator
Generisch€66.811.0★
G7 dexcom Sensor 1 St Blutzucker Diabetes G 7 Applikator 1 pieces
Becopa€72.445.0★
Dexcom G7 Sensor 1 St Blutzucker Diabetes G 7 Applikator Blood Sugar 1 pieces
Becopa€78.424.6★
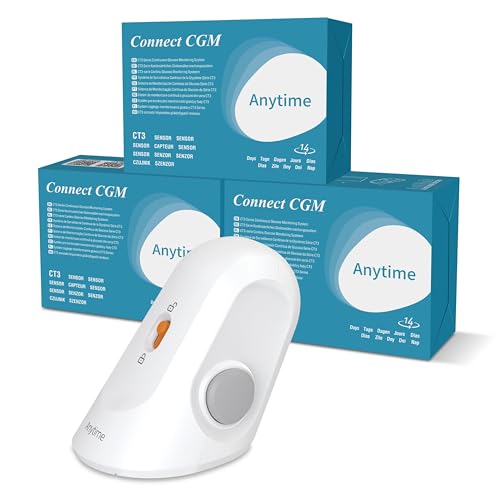
Connect Glukose-Monitoring 3x Sensor | Nur kompatibel mit Connect Transmitter | 42 Tage Blutzuckermessgerät ohne Stechen Sensor Einfache Anwendung
FORA€93.095.0★
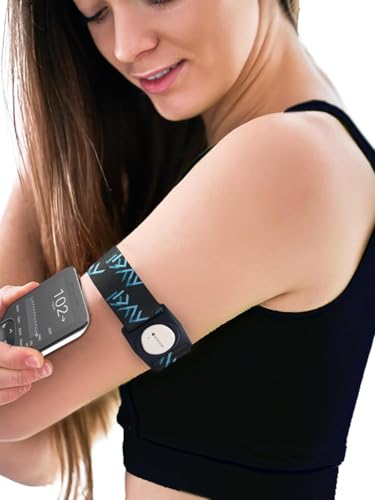
Verstellbares Armband für Dexcom G7 und Dexcom One+ Dia-Style elastische Halterung mit drehbarem Clip bequem und waschbar sicherer Schutz für Sensor blau S (23-29 cm ~ 9.1-11.4 in)
Kaio-Dia€17.335.0★
Demand & seasonality
Weekly Amazon search volume, last 104 weeks — +5.2% search growth over the last 90 days.Peak months: Jun · busiest ÷ quietest = 1.9×
Reviews
What buyers praise and complain about, mined from review topics.What buyers love
“Einfache Handhabung”
“Super Ware”
“Super Preis Leistung”
“Tut alles was es soll”
“Klappt alles super”
“Handhabung und App wünschenswert”
“Top Sensor”
“DIE Batterie ist frisch”
“Alles Top geklappt”
“Die Verbindung klappt problemlos”
What buyers complain about
“die Teststreifen sind unverschämt teuer (70,00 Euro)”
“Nicht ein richtiger Messwert”
“Funktioniert nicht”
“Inkompatible”
“Anbindung an die App nur mit Mobiltelefon in der Nähe”
“Defekt”
“Daher leider keine positive Bewertung”
“Anleitung lückenhaft”
“Leider hält das Produkt (die durchsichtige Variante) nicht was es verspricht,”
“Um die Software voll nützen zu können muß ma 99€ im Jahr bezahlen”