steam deck
Skip itWeak search conversion (0.4%) — this niche doesn't clear our bar today.
Market size
Great€905K€905K/yr · 884K searches
Quality gap
Good4.3★avg incumbent rating — lower means beatable quality
Returns
Okay3.1%return rate — above 6% kills the launch gate
Review moat
Okay2,181.53avg incumbent reviews — the moat a new listing must climb
Brand share
Okay80%top-5 brand share — brands hold most of the demand
Avg price
Okay€269.28avg listing price — sweet spot $15–$100
Competition
Okay65%top-5 click share — leaders hold, buyers still browse
Growth
Bad-30.6%90-day search growth — must beat 0% to launch
Price range
Bad€16.98–€880.21cheapest to priciest tracked listing — scored on the share inside $15–$100
Conversion
Bad0.4%search→purchase rate — share of searches ending in a sale
Competition
The top 5 products take 65% of clicks — established leaders, but buyers still shop beyond them.Brands
11 rising
Sellers
128
Top-5 brand share
80%
Open market
14%
- Elgato28%
- ASUS27%
- MSI9%
- Lenovo9%
- UGREEN7%
- SOOMFON6%
- Open — no brand owns it (5 brands, 14%)
Product shelf
Each bubble is one product — market share against review moat; bubble size tracks estimated sales, color grades how beatable the incumbent looks.
All 17 tracked products in this niche — three views at once, no toggling.
Top sellers
by 90-day click share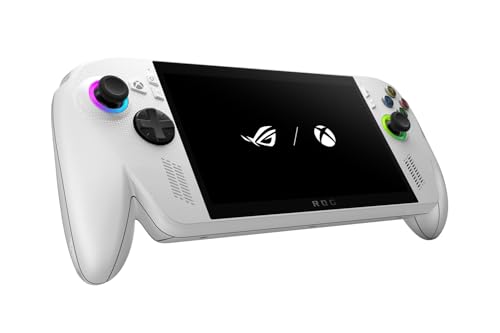
ASUS ROG Xbox Ally RC73YA Konsole | 7 FHD 120Hz IPS Touch Display | AMD Ryzen Z2 A Prozessor | 16GB RAM | 512GB SSD | AMD Radeon | Win11Home | White | 3Monate GamePass Premium
ASUS€482.774.1★33 rev
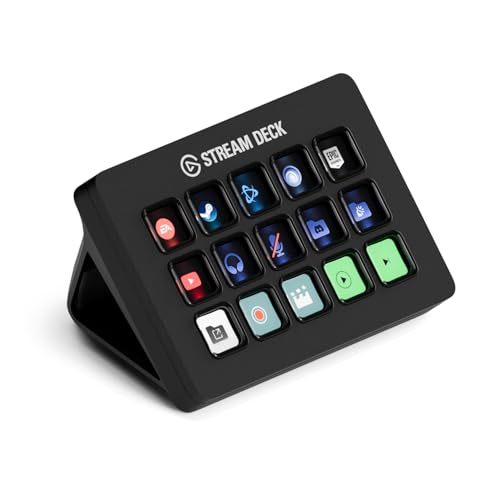
Elgato Stream Deck MK.2 Studio-Controller 15 Makrotasten
Elgato€105.424.7★10,151 rev

MSI Claw A1M-036 Gaming Handheld 7 Zoll FHD 120Hz IPS Display Intel Core Ultra 5 Prozessor 135H 16 GB RAM 512GB SSD Intel Arc Grafik Windows 11 Home Schwarz
MSI€364.004.0★141 rev
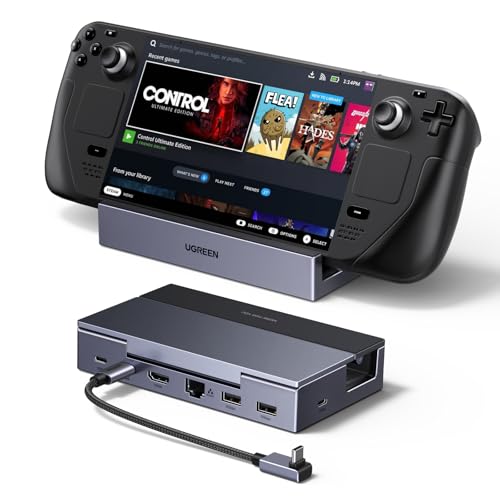
UGREEN Steam Deck Dock mit HDMI 4K@120Hz Verstellbares Docking Station mit 5Gbps USB A & USB C 3.0 100W PD-Ladung 1Gbps Ethernet Kompatibel mit Steam Deck OLED ROG Xbox Ally Legion go MSI Claw
UGREEN€28.824.5★996 rev

Lenovo Legion Go S Gaming Konsole | 8 WUXGA Display | AMD Ryzen Z2 Go | 16GB RAM | 1TB SSD | AMD Radeon Grafik | SteamOS | Nebula Nocturne schwarz
Lenovo€522.094.4★24 rev
Newest
by launch date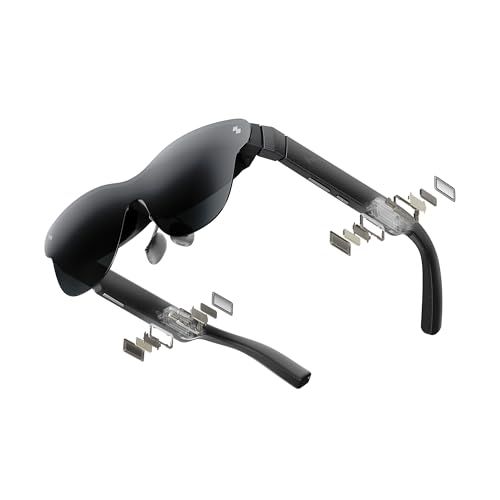
RayNeo Air 4 Pro AR/XR-Brille HDR10-Display Vision 4000 Chip 201 Zoll Virtuelles Kino 3D-Filme & Gaming Brillen für iPhone 17 16 15/Android/Switch 2/Mac/Steam Deck/PS4/5
RayNeo€274.32783 rev
ASUS ROG Xbox Ally RC73YA Konsole | 7 FHD 120Hz IPS Touch Display | AMD Ryzen Z2 A Prozessor | 16GB RAM | 512GB SSD | AMD Radeon | Win11Home | White | 3Monate GamePass Premium
ASUS€482.7733 rev
Lenovo Legion Go S Gaming Konsole | 8 WUXGA Display | AMD Ryzen Z2 Go | 16GB RAM | 1TB SSD | AMD Radeon Grafik | SteamOS | Nebula Nocturne schwarz
Lenovo€522.0924 rev
Lenovo Legion Go S Gaming Konsole | 8 WUXGA Display | AMD Ryzen Z2 Go | 16GB RAM | 512GB SSD | AMD Radeon Grafik | SteamOS | Nebula Nocturne schwarz
Lenovo€441.2230 rev
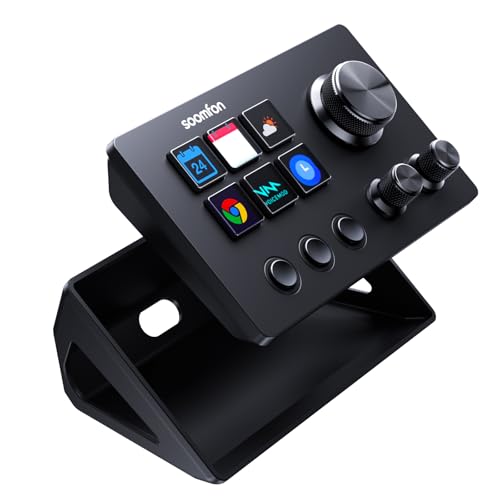
SOOMFON Stream Controller Deck SE Schwarz 6 LCD Makrotasten & Drehknöpfe auslösen von Aktion in Software wie OBS Voicemod Twitch YouTube für Streaming & Gaming kompatibel mit Mac & Windos
SOOMFON€43.46608 rev
Trending
90-day click momentumRayNeo Air 4 Pro AR/XR-Brille HDR10-Display Vision 4000 Chip 201 Zoll Virtuelles Kino 3D-Filme & Gaming Brillen für iPhone 17 16 15/Android/Switch 2/Mac/Steam Deck/PS4/5
RayNeo€274.323.9★
ASUS ROG Xbox Ally RC73YA Konsole | 7 FHD 120Hz IPS Touch Display | AMD Ryzen Z2 A Prozessor | 16GB RAM | 512GB SSD | AMD Radeon | Win11Home | White | 3Monate GamePass Premium
ASUS€482.774.1★
Lenovo Legion Go S Gaming Konsole | 8 WUXGA Display | AMD Ryzen Z2 Go | 16GB RAM | 1TB SSD | AMD Radeon Grafik | SteamOS | Nebula Nocturne schwarz
Lenovo€522.094.4★

Elgato Stream Deck Mini 6 anpassbare LCD-Makrotasten
Elgato€44.934.7★
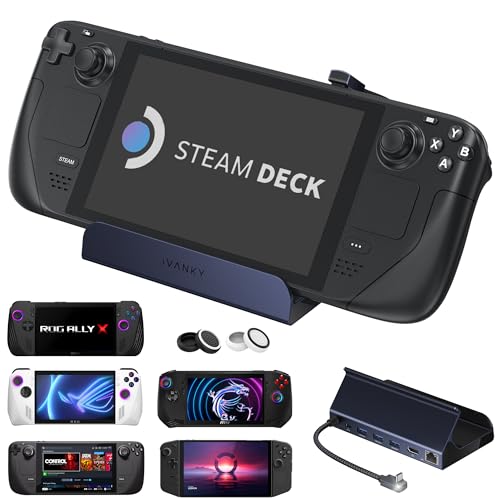
iVANKY Docking Station für Steam Deck/ROG Ally HDMI 2.1 4K@144Hz 1Gbps Ethernet 3*USB-A 3.0 100W USB-C Ladung 8-in-1 Dock Kompatibel mit ASUS ROG Alloy X/Legion go/Valve Steam Deck OLED/MSI Claw
IVANKY€28.094.4★
Demand & seasonality
Weekly Amazon search volume, last 79 weeks — -30.6% search growth over the last 90 days.Peak months: Nov, Dec · busiest ÷ quietest = 2.6×
Reviews
What buyers praise and complain about, mined from review topics.What buyers love
“Top Produkt”
“Super easy zu benutzen, falls man etwas nicht wissen sollte über Belegung etc bei google innerhalb kürzester Zeit Ergebnisse gefunden”
“Beste Investition ever”
“Super Produkt mit super Software”
“Hält was er verspricht”
“einfach zu installieren”
“Das Touchpanel dazwischen liefert super Informationen auf einen Blick”
“Top Brille, Super Geeignet für DJI Air 3S”
“Die Umschaltung am Elgato funktioniert tadellos”
“Sehr schönes Design”
What buyers complain about
“Android App trash”
“Ist absolut nicht sein Geld wert”
“❌ Was besser sein könnte (Contra):”
“Nicht stabile Verbindung”
“funktioniert nicht”
“Alles Blurry und egal wie ich die Brille aufsetze/einstelle sehe ich die Ränder des Bildes nicht”
“aber keinen perfect fit.”
“Sound issues”
“creation von eigenen Buttons ist absolut schwierig”
“Mein Problem mit dem Tragekomfort:”