rtx 3060 ti
Skip itPrices mostly outside the sweet spot ($145.10–$492.75) — this niche doesn't clear our bar today.
Review moat
Good559.43avg incumbent reviews — the moat a new listing must climb
Competition
Good50%top-5 click share — leaders hold, buyers still browse
Market size
Okay€204K€204K/yr · 115K searches
Returns
Okay4.4%return rate — above 6% kills the launch gate
Quality gap
Okay4.5★avg incumbent rating — lower means beatable quality
Avg price
Okay€299.65avg listing price — sweet spot $15–$100
Conversion
Bad0.6%search→purchase rate — share of searches ending in a sale
Growth
Bad-38.1%90-day search growth — must beat 0% to launch
Brand share
Bad98%top-5 brand share — brand-locked demand
Price range
Bad€145.10–€492.75cheapest to priciest tracked listing — scored on the share inside $15–$100
Competition
The top 5 products take 50% of clicks — established leaders, but buyers still shop beyond them.Brands
6 flat
Sellers
190
Top-5 brand share
98%
Open market
0%
- ASUS41%
- MSI34%
- GeForce12%
- Gigabyte7%
- ZOTAC5%
- Plyisty2%
Product shelf
Each bubble is one product — market share against review moat; bubble size tracks estimated sales, color grades how beatable the incumbent looks.
All 21 tracked products in this niche — three views at once, no toggling.
Top sellers
by 90-day click share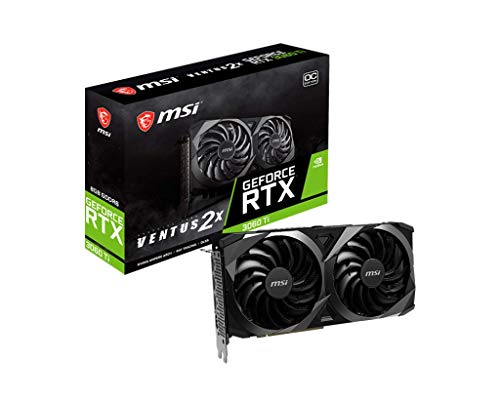
MSI GeForce RTX 3060 Ti Ventus 2X OC Gaming Grafikkarte - NVIDIA RTX 3060 Ti 8GB GDDR6 Speicher 256-bit 14 Gbps
MSI€299.674.4★647 rev
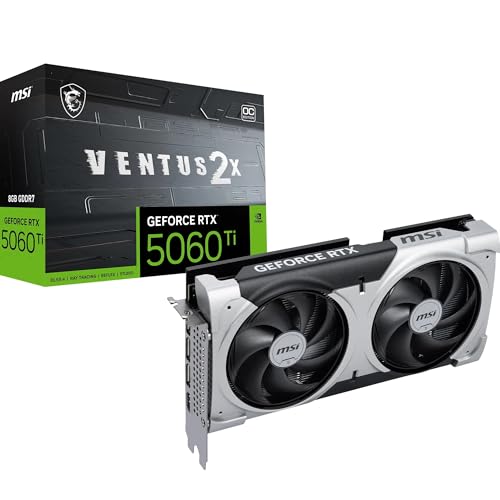
MSI GeForce RTX 5060 Ti 8G Ventus 2X OC Plus - 8GB GDDR7 (28Gbps/128-bit) PCIe 5 Boost: 2602 MHz HDMI 2.1b DisplayPort 2.1b Extra Core-Pipes
MSI€268.114.5★220 rev
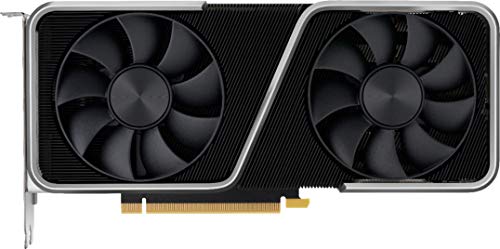
NVIDIA GeForce RTX 3060 Ti Founders Edition Grafikkarte 8 GB GDDR6 PCI Express 4.0
GeForce€492.754.6★252 rev

ASUS Dual GeForce RTX3060 TI Mini 8G V2 OC Edition Gaming Grafikkarte (Lite Hash Rate (LHR) Nvidia Ampere PCIe 4.0 8GB DDR6 Speicher 2x HDMI 1.2 3x DisplayPort 1.4a DUAL-RTX3060TI-O8G-Mini-V2)
ASUS€298.384.5★134 rev

ASUS GeForce Dual RTX 3060 12GB V2 OC Edition Gaming Grafikkarte (GDDR6 Speicher PCIe 4.0 1x HDMI 2.1 3X DisplayPort 1.4a DUAL-RTX3060-O12G-V2)
ASUS€225.964.6★3,095 rev
Newest
by launch date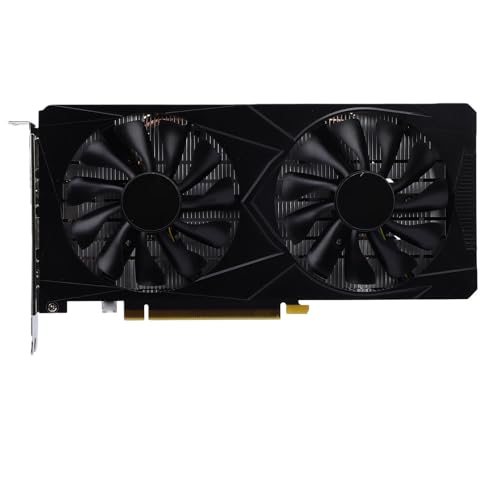
Plyisty RTX 3060 Gaming-Grafikkarte 6 GB 192 Bit PCIe 3.0 X16 Kühlung mit Zwei Lüftern DLSS- und Raytracing-Unterstützung mit Turing-Architektur für 1080p 2K-Gaming
Plyisty€391.930 rev
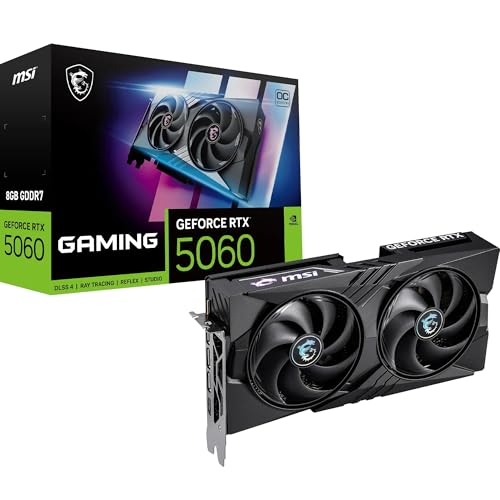
MSI GeForce RTX 5060 8G Gaming OC - 8GB GDDR7 (28Gbps/128-bit) PCIe 5 Boost: 2625 Hz HDMI 2.1b DisplayPort 2.1b
MSI€264.281,759 rev
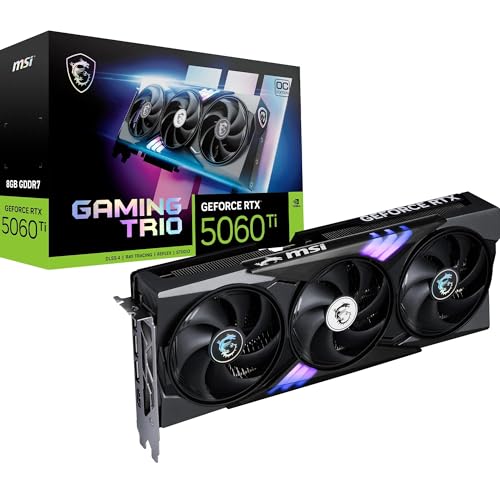
MSI GeForce RTX 5060 Ti 8G Gaming Trio OC - 8 GB GDDR7 (28Gbps/128-bit) PCIe 5 Boost: 2647 MHz HDMI 2.1b DisplayPort 2.1b
MSI€292.1353 rev
MSI GeForce RTX 5060 Ti 8G Ventus 2X OC Plus - 8GB GDDR7 (28Gbps/128-bit) PCIe 5 Boost: 2602 MHz HDMI 2.1b DisplayPort 2.1b Extra Core-Pipes
MSI€268.11220 rev
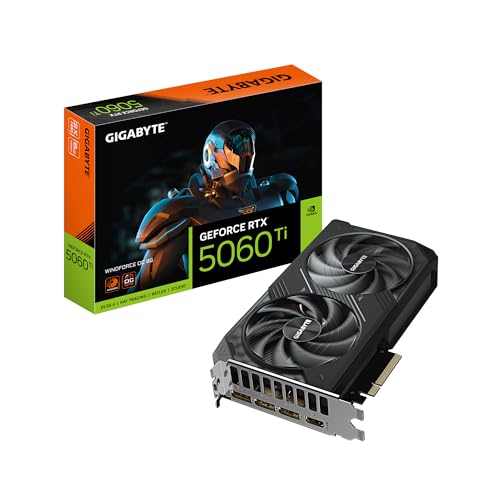
Gigabyte GeForce RTX 5060 Ti WINDFORCE OC 8G Grafikkarte 8 GB GDDR7 128 Bit PCI-E 5.0 2587 MHz Kernfrequenz 3 x DisplayPort 1 x HDMI GV-N506TWF2OC-8GD
Gigabyte€296.4187 rev
Trending
90-day click momentumPlyisty RTX 3060 Gaming-Grafikkarte 6 GB 192 Bit PCIe 3.0 X16 Kühlung mit Zwei Lüftern DLSS- und Raytracing-Unterstützung mit Turing-Architektur für 1080p 2K-Gaming
Plyisty€391.930.0★
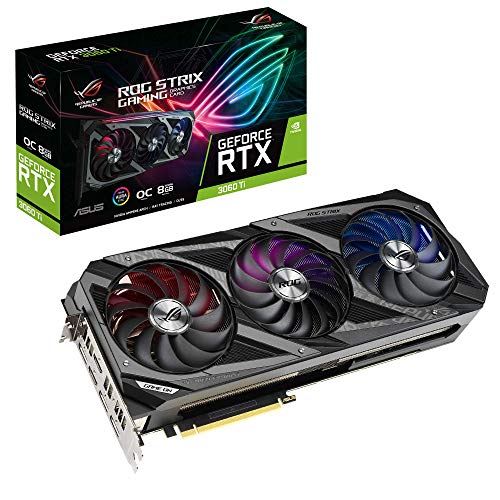
ASUS ROG Strix GeForce RTX 3060 TI OC Edition Gaming Grafikkarte (Nvidia Ampere DLSS PCIe 4.0 8GB DDR6 Speicher 2x HDMI 2.1 3x DisplayPort 1.4a ROG-STRIX-RTX3060TI-O8G-GAMING) One size
ASUS€299.724.7★
ASUS Dual GeForce RTX3060 TI Mini 8G V2 OC Edition Gaming Grafikkarte (Lite Hash Rate (LHR) Nvidia Ampere PCIe 4.0 8GB DDR6 Speicher 2x HDMI 1.2 3x DisplayPort 1.4a DUAL-RTX3060TI-O8G-Mini-V2)
ASUS€298.384.5★
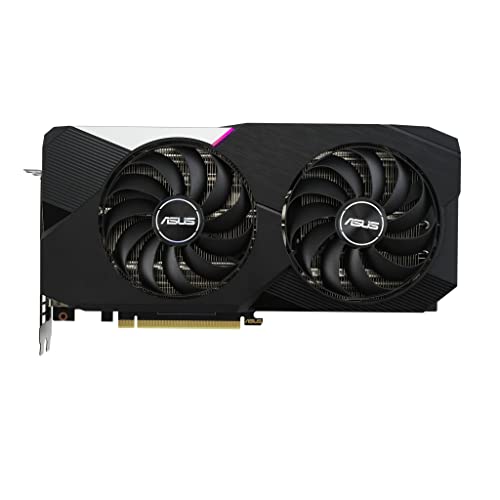
ASUS Dual GeForce RTX 3060 TI OC Edition Gaming Grafikkarte (Nvidia Ampere DLSS PCIe 4.0 8GB DDR6 Speicher 2x HDMI 1.2 3x DisplayPort 1.4a DUAL-RTX3060TI-O8G) One size
ASUS€300.774.9★
MSI GeForce RTX 5060 Ti 8G Gaming Trio OC - 8 GB GDDR7 (28Gbps/128-bit) PCIe 5 Boost: 2647 MHz HDMI 2.1b DisplayPort 2.1b
MSI€292.134.4★
Demand & seasonality
Weekly Amazon search volume, last 85 weeks — -38.1% search growth over the last 90 days.Peak months: Jan, Nov, Dec · busiest ÷ quietest = 2.9×
Reviews
What buyers praise and complain about, mined from review topics.What buyers love
“Beste Investition”
“Leistung is ok”
“Installation verlief problemlos”
“Hält was es verspricht”
“solide 1080p- bis 1440p-Gaming-Performance”
“Starker Allround-Gaming-Boost für dein Setup”
“funzt perfekt”
“Das Dual-Fan-Design macht einen richtig guten Job”
“Super Grafikkarte”
“Alles super - 16 GB sind besser”
What buyers complain about
“leider atm 40€ über dem durchschnittlichen Bestpreis (von~150/Stand 26.05.26).”
“instabile Situationen unter Last”
“die erste ging nach einem jahr kaputt!!bei”
“Es handelt sich um einen Betrug”
“Bei der Anzeige von 2 Stück HD Videos wird die Heat Pipe nur handwarm, es laufen keine Lüfter”
“Dir Anleitung war doof dazu”
“Kurzer PCI-E 5.0 Slot”
“Kein High-End Produkt”
“ich kann das Softwareproblem nicht beseitigen.”
“Unangenehm laut”