monitor
Worth a lookShows a $10.2M/yr market, but soft demand (-25.2% this quarter) keeps it on the watch list.
Market size
Incredible€10.2M€10.2M/yr · 12.0M searches
Avg price
Great€92.97avg listing price — sweet spot $15–$100
Competition
Good42%top-5 click share — leaders hold, buyers still browse
Review moat
Good641avg incumbent reviews — the moat a new listing must climb
Returns
Good2.2%return rate — above 6% kills the launch gate
Brand share
Good74%top-5 brand share — brands hold most of the demand
Quality gap
Okay4.5★avg incumbent rating — lower means beatable quality
Price range
Okay€54.68–€200.81cheapest to priciest tracked listing — scored on the share inside $15–$100
Growth
Bad-25.2%90-day search growth — must beat 0% to launch
Conversion
Bad0.9%search→purchase rate — share of searches ending in a sale
Competition
The top 5 products take 42% of clicks — established leaders, but buyers still shop beyond them.Brands
16 falling
Sellers
273
Top-5 brand share
74%
Open market
19%
- ASUS31%
- Minifire13%
- PHILIPS12%
- Samsung11%
- Lenovo8%
- MSI7%
Product shelf
Each bubble is one product — market share against review moat; bubble size tracks estimated sales, color grades how beatable the incumbent looks.
All 42 tracked products in this niche — three views at once, no toggling.
Top sellers
by 90-day click share
ASUS Eye Care VY279HGR - 27 Zoll Full HD Monitor - 120 Hz 1ms MPRT AdaptiveSync GameFast Input - IPS Panel Vesa 100x100 16:9 1920x1080 HDMI D-Sub
ASUS€83.784.6★981 rev

ASUS Eye Care VY249HGR - 24 Zoll Full HD Monitor - 120 Hz 1ms MPRT AdaptiveSync GameFast Input - IPS Panel Vesa 100x100 16:9 1920x1080 D-Sub HDMI
ASUS€66.474.6★1,196 rev

MSI MAG 27C6F 27 Zoll FHD Curved Gaming Monitor - 1500R 1920 x 1080 Rapid VA Panel 180 Hz / 1ms (GtG) Adaptive-Sync - DP 1.2a HDMI CEC
MSI€89.214.6★1,540 rev
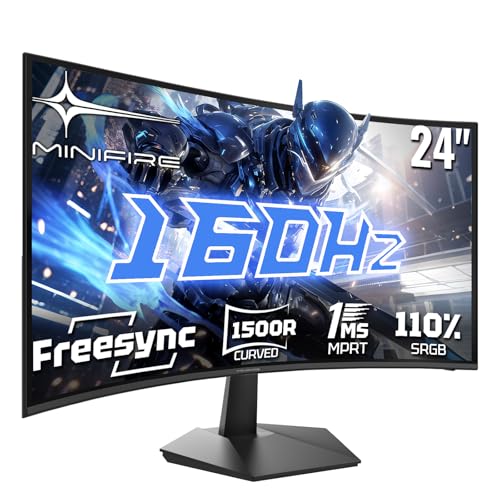
Minifire Gaming Curved Monitor 24 Zoll 160Hz Curved Gaming Monitor 1500R 1Ms sRGB110% FHD 1080P Computer Screen VESA Compatible Eye Care Adaptive Sync HDMIDP Ports MFG24C1L
Minifire€69.784.4★776 rev

Philips 24E2N1100LB - 24 Zoll Full HD Monitor Adaptive Bildsynchronisation (1920x1080 100 Hz 1x D-Sub 1x HDMI 1.4) schwarz
PHILIPS€54.684.5★217 rev
Newest
by launch date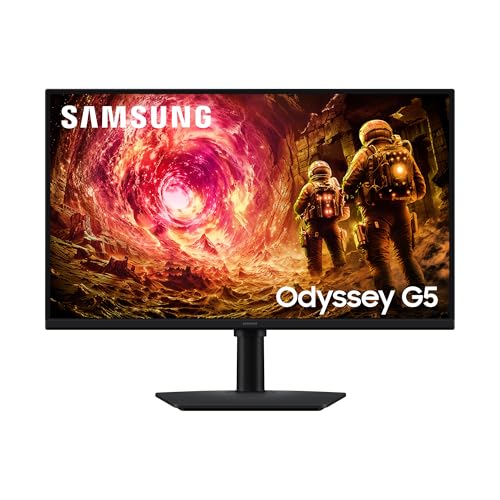
Samsung 27 Zoll Odyssey G50F Gaming Monitor PC-Bildschirm mit IPS-Panel 2.560 x 1.440 Pixel (QHD) 180 Hz 1 ms (G/G) AMD FreeSync Premium NVIDIA G-Sync HDR10 LS27FG502EUXEN
Samsung€133.3543 rev
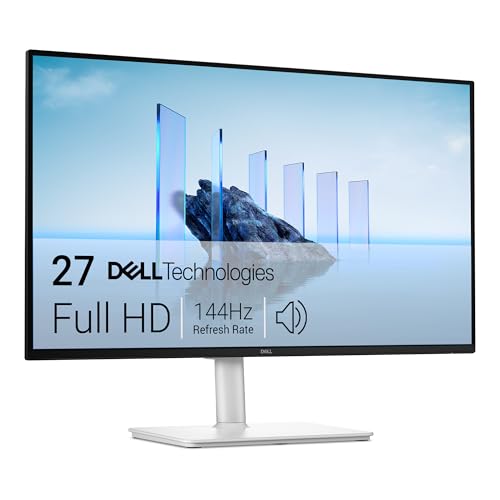
Dell 27 Plus Monitor - S2725HSM Full HD (1920x1080) 144Hz IPS 1ms MPRT AMD FreeSync 99% sRGB Höhenverstellbar Eingebaute Lautsprecher 2 HDMI 3 Jahre Garantie Weiß
Dell€121.43198 rev
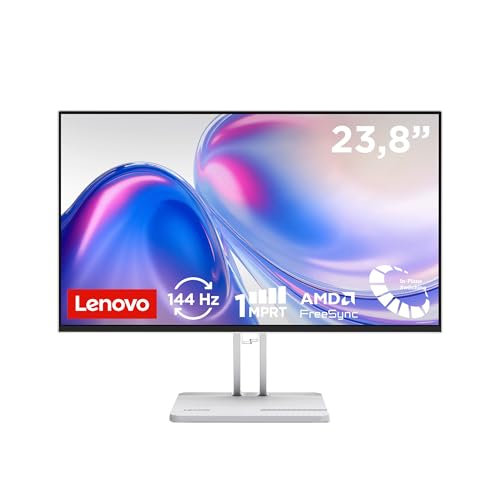
Lenovo L24-4C | 24 Full HD WLED Monitor | 1920x1080 | 16:9 | 144Hz | 1ms Reaktionszeit | HDMI | VGA | Audio 3.5mm | 4-seitig-Panel | TÜV Augenschutz | AMD FreeSync | grau | 3.8 kg
Lenovo€69.7844 rev
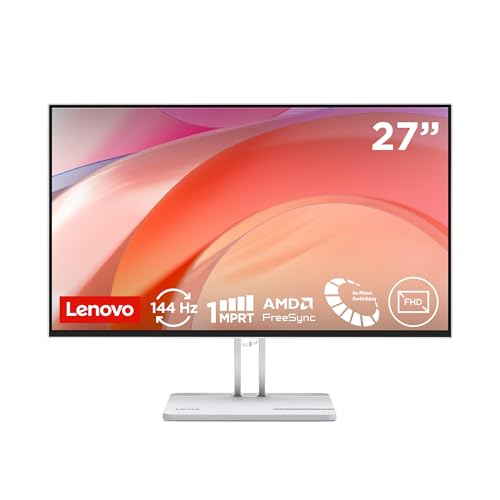
Lenovo L27-4C | 27 Full HD WLED Monitor | 1920x1080 | 16:9 | 144Hz | 1ms Reaktionszeit | HDMI | VGA | Audio 3.5mm | 4-seitig-Panel | TÜV Augenschutz | AMD FreeSync | grau | 3.9 kg
Lenovo€83.8462 rev
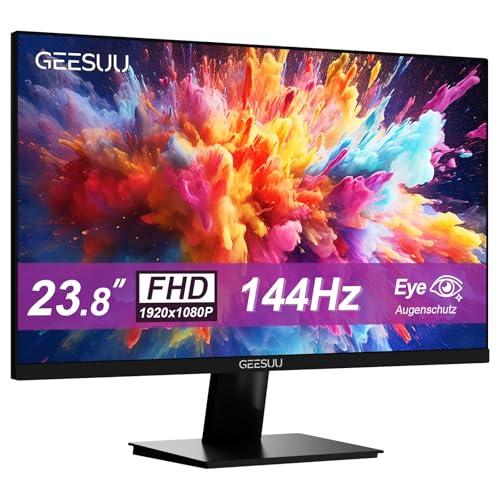
GEESUU 24 Zoll Monitor PC Bildschirm 144Hz FHD 1080p Gaming Monitore 5ms VA Eye-Care Computer Bildschirm 99% sRGB VESA 75x75mm HDMI 2.0 & DP 1.2
GEESUU€58.2440 rev
Trending
90-day click momentumSamsung 27 Zoll Odyssey G50F Gaming Monitor PC-Bildschirm mit IPS-Panel 2.560 x 1.440 Pixel (QHD) 180 Hz 1 ms (G/G) AMD FreeSync Premium NVIDIA G-Sync HDR10 LS27FG502EUXEN
Samsung€133.354.5★
Lenovo L24-4C | 24 Full HD WLED Monitor | 1920x1080 | 16:9 | 144Hz | 1ms Reaktionszeit | HDMI | VGA | Audio 3.5mm | 4-seitig-Panel | TÜV Augenschutz | AMD FreeSync | grau | 3.8 kg
Lenovo€69.784.9★
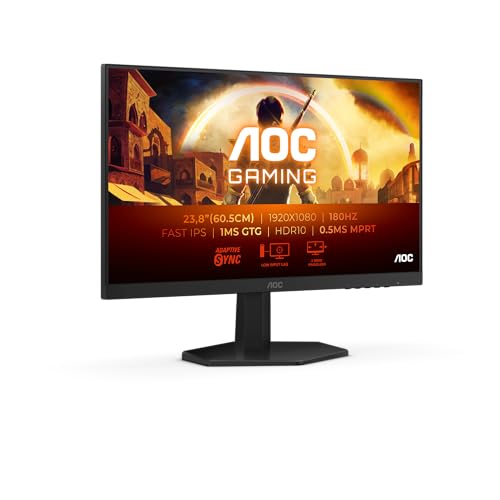
AOC 24G42E 24 Zoll FHD Gaming Monitor 180Hz Fast IPS Panel 1ms GtG HDR10 G-Sync Compatible (1920x1080 HDMI 1x 2.0 DP 1x 1.4) Schwarz
AOC€67.684.6★
Philips 24E2N1100LB - 24 Zoll Full HD Monitor Adaptive Bildsynchronisation (1920x1080 100 Hz 1x D-Sub 1x HDMI 1.4) schwarz
PHILIPS€54.684.5★
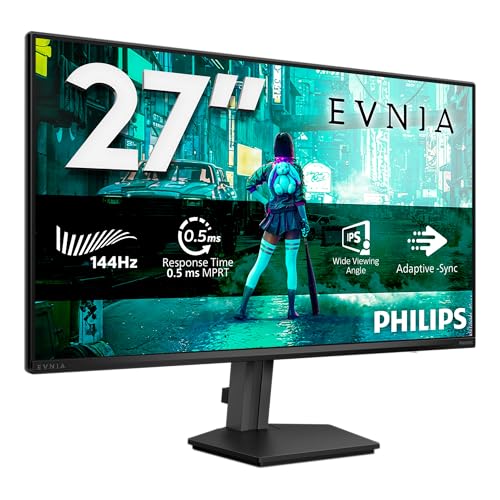
Philips 27M2N3200NF 27 Zoll FHD Monitor 144Hz IPS 1ms MPRT Adaptive Sync G-Sync Comp. HDR10 (1920x1080 HDMI 1x 2.0 DP 1x 1.4) Schwarz
PHILIPS€69.524.5★
Demand & seasonality
Weekly Amazon search volume, last 85 weeks — -25.2% search growth over the last 90 days.Peak months: Nov, Dec · busiest ÷ quietest = 3.1×
Reviews
What buyers praise and complain about, mined from review topics.What buyers love
“Nice Price”
“Super Monitor”
“Super Produkt”
“Produkt wie beschrieben”
“Passt”
“Lässt sich easy installieren”
“Cristal Clear und super Farben”
“modernes Design”
“Samsung Monitor S70D: Brilliante Farben und superscharftes Bild”
“Guter Monitor zum Anschluß an Smartphone und/oder Tablet”
What buyers complain about
“Was fehlt wären integrierte Lautsprecher”
“Haltbarkeit schlecht”
“minderwertige Qualität”
“Ergebnis ist ein wackeliger und schiefer Monitor”
“Blaustichig”
“passt gar nicht”
“Betrügerische Informationen im Angebot”
“Ungleichmäßige Ausleuchtung”
“Einziger Minuspunkt: nicht höhenverstellbar”
“Die Farben wirken im HDR-Betrieb eher deplatziert”