grafikkarte
Skip itPricing outside the sweet spot ($722.95 avg) — this niche doesn't clear our bar today.
Market size
Incredible€4.8M€4.8M/yr · 2.6M searches
Competition
Great28%top-5 click share — an open shelf
Review moat
Great340.14avg incumbent reviews — the moat a new listing must climb
Quality gap
Okay4.5★avg incumbent rating — lower means beatable quality
Returns
Okay4.1%return rate — above 6% kills the launch gate
Brand share
Bad90%top-5 brand share — brand-locked demand
Growth
Bad-26.6%90-day search growth — must beat 0% to launch
Conversion
Bad0.3%search→purchase rate — share of searches ending in a sale
Price range
Bad€33.21–€7651.15cheapest to priciest tracked listing — scored on the share inside $15–$100
Avg price
Bad€722.95avg listing price — sweet spot $15–$100
Competition
Clicks spread well past the top 5 (28% combined) — an open shelf where new products get seen.Brands
14 rising
Sellers
320
Top-5 brand share
90%
Open market
8%
- ASUS42%
- Gigabyte24%
- MSI16%
- Sapphire4%
- KFA24%
- maxsun2%
- Open — no brand owns it (8 brands, 8%)
Product shelf
Each bubble is one product — market share against review moat; bubble size tracks estimated sales, color grades how beatable the incumbent looks.
All 74 tracked products in this niche — three views at once, no toggling.
Top sellers
by 90-day click share
ASUS Dual GeForce RTX 3050 OC Edition 6GB GDDR6 Gaming Grafikkarte (Nvidia GeForce RTX3050 DLSS PCIe 4.0 1x HDMI 2.1a 1x DisplayPort 1.4a DUAL-RTX3050-O6G)
ASUS€145.104.6★618 rev

ASUS Dual Radeon RX 7600 EVO OC Edition 8GB GDDR6 Gaming Grafikkarte (AMD Radeon RX7600 PCIe 4.0 1x HDMI 2.1 3X DisplayPort 1.4a)
ASUS€206.034.7★399 rev
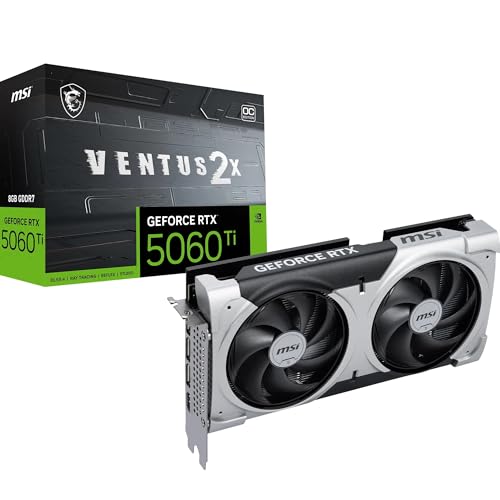
MSI GeForce RTX 5060 Ti 8G Ventus 2X OC Plus - 8GB GDDR7 (28Gbps/128-bit) PCIe 5 Boost: 2602 MHz HDMI 2.1b DisplayPort 2.1b Extra Core-Pipes
MSI€268.114.5★220 rev

ASUS Dual GeForce RTX 5060 Ti 16GB GDDR7 OC Edition Gaming Grafikkarte (Nvidia GeForce RTX5060Ti DLSS 4 2 5-Slot Design PCIe 5.0 3X DisplayPort 2.1b 1x HDMI 2.1b)
ASUS€437.934.7★293 rev
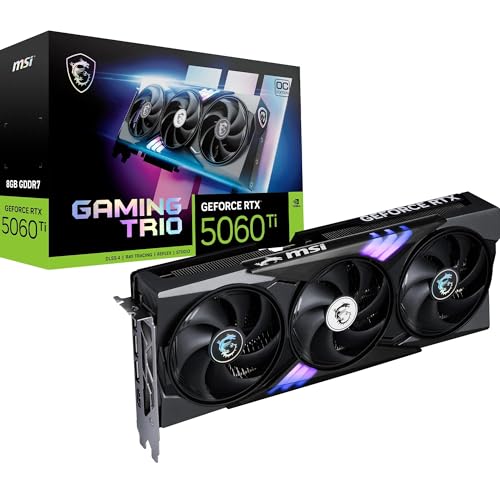
MSI GeForce RTX 5060 Ti 8G Gaming Trio OC - 8 GB GDDR7 (28Gbps/128-bit) PCIe 5 Boost: 2647 MHz HDMI 2.1b DisplayPort 2.1b
MSI€292.134.4★53 rev
Newest
by launch date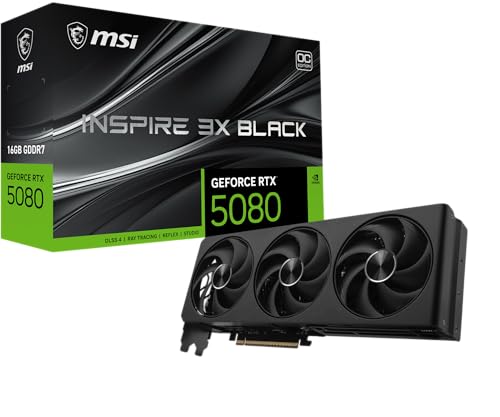
MSI GeForce RTX 5080 16G Inspire 3X OC Black - 16GB GDDR7 (30Gbps/256-bit) PCIe 5 Boost: 2640 MHz HDMI 2.1b DisplayPort 2.1b
MSI€1083.92691 rev
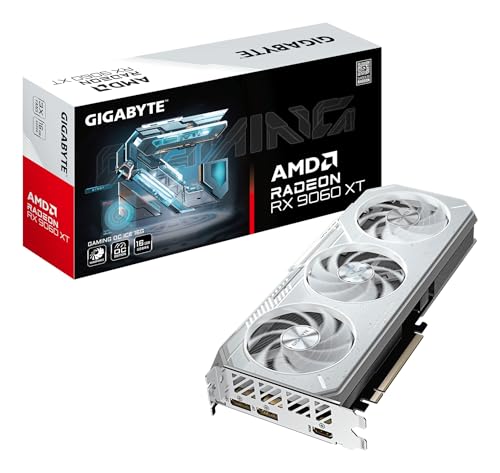
Gigabyte Gaming Grafikkarte Radeon RX 9060 XT OC Ice 16G - 16GB GDDR6 256bit PCI-E 5.0 3320 MHz Core Clock 2 x DisplayPort 1 x HDMI GV-R906XGAMINGOCICE-16GD
Gigabyte€349.6353 rev
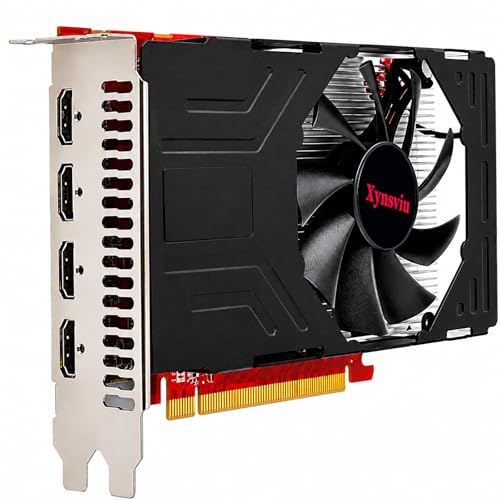
Xynsviu Radeon RX 560 2GB Grafikkarte GPU 4 HDMI PC Anschlüsse für Mehrfachbildschirm grafikkarten DDR5 DirectX 12 128 Bit PCI Express x16 Graphics CcardsRX560 2G 4HDMI
Xynsviu€85.686 rev
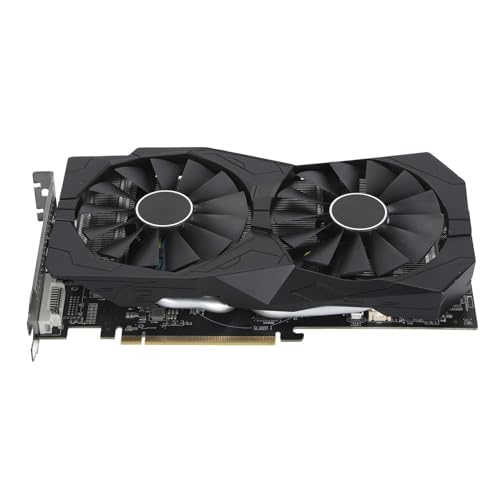
Ouitble AMD Radeon RX 580 8GB GDDR5 Grafikkarte 256-Bit 2048SP PC-Gaming-Grafikkarte mit PCI Express 3.0 X16 3×DisplayPort 1×DVI 1×HD-Multimedia-Schnittstelle für Desktop Computer
Ouitble€140.5410 rev
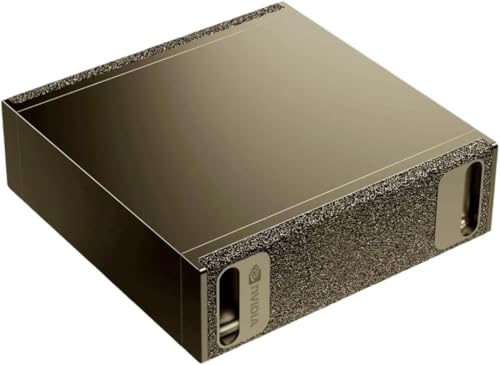
NVIDIA DGX Spark - Personal AI Desktop Supercomputer - Desktop GB10 Grace Blackwell Chip
NVIDIA€5185.7956 rev
Trending
90-day click momentumMSI GeForce RTX 5080 16G Inspire 3X OC Black - 16GB GDDR7 (30Gbps/256-bit) PCIe 5 Boost: 2640 MHz HDMI 2.1b DisplayPort 2.1b
MSI€1083.924.4★
MSI GeForce RTX 5060 Ti 8G Gaming Trio OC - 8 GB GDDR7 (28Gbps/128-bit) PCIe 5 Boost: 2647 MHz HDMI 2.1b DisplayPort 2.1b
MSI€292.134.4★
Xynsviu Radeon RX 560 2GB Grafikkarte GPU 4 HDMI PC Anschlüsse für Mehrfachbildschirm grafikkarten DDR5 DirectX 12 128 Bit PCI Express x16 Graphics CcardsRX560 2G 4HDMI
Xynsviu€85.683.8★
ASUS Dual GeForce RTX 5060 Ti 16GB GDDR7 OC Edition Gaming Grafikkarte (Nvidia GeForce RTX5060Ti DLSS 4 2 5-Slot Design PCIe 5.0 3X DisplayPort 2.1b 1x HDMI 2.1b)
ASUS€437.934.7★
NVIDIA DGX Spark - Personal AI Desktop Supercomputer - Desktop GB10 Grace Blackwell Chip
NVIDIA€5185.794.2★
Demand & seasonality
Weekly Amazon search volume, last 85 weeks — -26.6% search growth over the last 90 days.Peak months: Nov, Dec · busiest ÷ quietest = 3.0×
Reviews
What buyers praise and complain about, mined from review topics.What buyers love
“Beste Investition”
“Super clean Performance”
“Leistungstechnisch bekommt man genau das, was man in der 60er-Klasse erwartet: Für Full HD (1920x1080)”
“Performance ist super”
“Produkt wie beschrienen”
“Top Karte mit geilem Design”
“Temperaturen sind vernünftig”
“Die Installation war unkompliziert”
“Super Leistung”
“Für mein System eine sehr gute Graphikkarte”
What buyers complain about
“leider atm 40€ über dem durchschnittlichen Bestpreis (von~150/Stand 26.05.26).”
“jedoch lautes Spulenfiepen,”
“Temperaturen nie mehr als 68°C”
“und wirklich riesig”
“Kein High End Ersatz”
“funktioniert nicht”
“Nachdem Zusammenbau lief erstmal nichts”
“Die Software ist leider so”
“War nicht kompatibel”
“Treiberprobleme, Soundkarte geht nicht mehr”