dell dockingstation
Skip itBrand-locked demand (top 5 brands take 100% of clicks) — this niche doesn't clear our bar today.
Quality gap
Great4.2★avg incumbent rating — lower means beatable quality
Returns
Great1.9%return rate — above 6% kills the launch gate
Avg price
Good€105.15avg listing price — sweet spot $15–$100
Review moat
Good728.08avg incumbent reviews — the moat a new listing must climb
Market size
Good€437K€437K/yr · 121K searches
Conversion
Okay3.4%search→purchase rate — share of searches ending in a sale
Price range
Okay€32.04–€215.71cheapest to priciest tracked listing — scored on the share inside $15–$100
Competition
Bad82%top-5 click share — a locked-up shelf
Growth
Bad-32.8%90-day search growth — must beat 0% to launch
Brand share
Bad100%top-5 brand share — brand-locked demand
Competition
The top 5 products capture 82% of clicks — a locked-up shelf that new listings rarely crack.Brands
2 falling
Sellers
145
Top-5 brand share
100%
Open market
0%
- Dell98%
- LIONWEI2%
- Open — no brand owns it (0%)
Product shelf
Each bubble is one product — market share against review moat; bubble size tracks estimated sales, color grades how beatable the incumbent looks.
All 12 tracked products in this niche — three views at once, no toggling.
Top sellers
by 90-day click share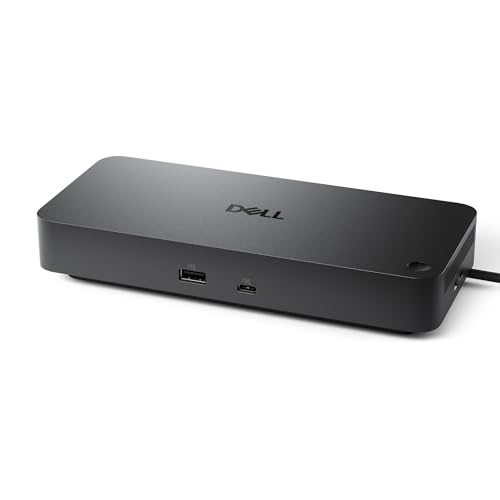
Dell Pro Dock WD25 USB-C-Dockingstation mit 100W Ladeleistung 4 Display-Support 2X DP 1.4 HDMI 2.1 6 USB-Ports 2.5GbE Ethernet Kompaktes Nachhaltigkeitsdesign
Dell€150.304.5★56 rev

Dell Docking Station WD19 USB 3.2 HDMI K20A inklusive 180 Watt Netzteil - WD19-180W
Dell€67.094.2★39 rev

Dell D6000 USB-C Triple Docking Station Up to Three 4K Displays via USB-C UHD 5K (Generalüberholt)
Dell€53.814.0★274 rev

Dell WD19S 130W Docking Station (m. Dell ExpressCharge laden USB-C 3.1 USB-C-Multifunktions-DisplayPort 3 Jahre Hardwareservice) Schwarz
Dell€135.424.2★331 rev

DELL WD19S-130W Dockingstation USB 3.2 Gen 2 (3.1 Gen 2) Type-C Schwarz (Renoviert)
Dell€60.543.5★81 rev
Newest
by launch dateDell Pro Dock WD25 USB-C-Dockingstation mit 100W Ladeleistung 4 Display-Support 2X DP 1.4 HDMI 2.1 6 USB-Ports 2.5GbE Ethernet Kompaktes Nachhaltigkeitsdesign
Dell€150.3056 rev
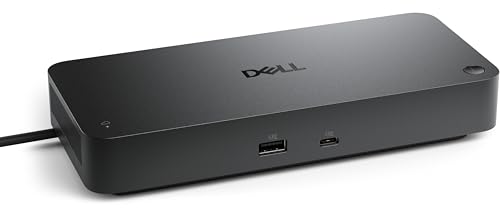
Dell Pro Smart Dock SD25 USB-C-Dockingstation mit 130W Ladeleistung 4 Display-Support HDMI 2.1 Dual DP 1.4 WLAN-Management 2.5GbE Nachhaltiges Design
Dell€179.5163 rev
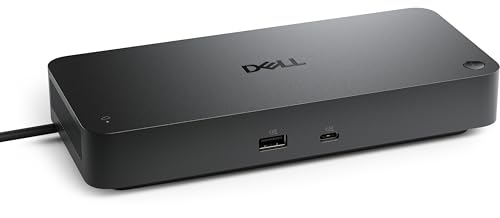
Dell Pro Thunderbolt 4 Smart Dock SD25TB4 USB-C-Dockingstation mit 130W Ladeleistung 4X 4K Display-Support Dual DP 1.4 HDMI 2.1 2X Thunderbolt 4 2.5GbE WLAN-Management Ökodesign
Dell€215.71125 rev

USB C Docking Station Dual Monitor 8 in 1 Laptop Docking Station 2 Monitore USB C Hub mit 4K Dual HDMI DisplayPort 1Gbps Ethernet 100W PD 3 USB A/C 3.0 Adapter Kompatibel mit Dell HP
LIONWEI€32.046,091 rev
DELL WD19S-130W Dockingstation USB 3.2 Gen 2 (3.1 Gen 2) Type-C Schwarz (Renoviert)
Dell€60.5481 rev
Trending
90-day click momentumDell Pro Thunderbolt 4 Smart Dock SD25TB4 USB-C-Dockingstation mit 130W Ladeleistung 4X 4K Display-Support Dual DP 1.4 HDMI 2.1 2X Thunderbolt 4 2.5GbE WLAN-Management Ökodesign
Dell€215.714.3★
Dell Docking Station WD19 USB 3.2 HDMI K20A inklusive 180 Watt Netzteil - WD19-180W
Dell€67.094.2★
USB C Docking Station Dual Monitor 8 in 1 Laptop Docking Station 2 Monitore USB C Hub mit 4K Dual HDMI DisplayPort 1Gbps Ethernet 100W PD 3 USB A/C 3.0 Adapter Kompatibel mit Dell HP
LIONWEI€32.044.3★
Dell Pro Dock WD25 USB-C-Dockingstation mit 100W Ladeleistung 4 Display-Support 2X DP 1.4 HDMI 2.1 6 USB-Ports 2.5GbE Ethernet Kompaktes Nachhaltigkeitsdesign
Dell€150.304.5★

Dell DA310 7-in-1 USB-C Adapter ( 4K (3840 x 2160) @ 30Hz VGA FHD (1920 x 1080) @ 60 Hz HDMI 2.0 bis 4K@60Hz Displayport RJ45 USB-A 3.1 3 Jahre Service) Anthrazit
Dell€61.874.4★
Demand & seasonality
Weekly Amazon search volume, last 85 weeks — -32.8% search growth over the last 90 days.Peak months: Nov · busiest ÷ quietest = 2.2×
Reviews
What buyers praise and complain about, mined from review topics.What buyers love
“Super Produkt”
“Macht was es soll”
“Gut und günstig”
“Super-Teil, funktioniert auch mit Linux/Windows/Apple”
“die Verbindung läuft stabil.”
“Funktioniert sehr stabil”
“Passt perfekt und funktioniert wie gewünscht”
“Funktioniert gut bisher (ca 1 Monat)”
“Einrichtung ging schnell und einfach, die Dockingstation benötigt wenig Platz und lässt sich perfekt hinter dem Bildschirm verstauen”
“Artikel wie Neu”
What buyers complain about
“Lebte ein Jahr, dann war sie tot”
“Ohne Funktion”
“Motor macht Geräusche”
“Würde null geben wenn ich könnte überhitzt sofort”
“Defekte Ware”
“auch das wäre grenzwertig.”
“Passt nicht”
“ein etwas merkwürdig instabiler USB-USB-C Adapter.”
“Für mich leider absolute Fehlinvestition”
“Da das Gerät generalüberholt recht günstig war, ist der Deal trotzdem OK”